Figures & data
Figure 1. Characterisation of decellularized rabbit uterus matrix (dUECM). (A) Macroscopic inspection of the uterus before (native) and after (dUECM) decellularization. DAPI (B) and haematoxylin and eosin (H&E) staining (C) show that most of the nuclei were removed. (D) Masson staining and immunofluorescent micrographs of rabbit uterus thin sections before and after decellularization (native and dUECM, respectively) using antibodies against extracellular matrix components. Quantification of residual DNA (E), total protein (F) and soluble collagen (G). MT, Masson staining (fibrin), Col IV, collagen IV; LN, laminin. The scale bar represents 100 μm. ***, p < .001.
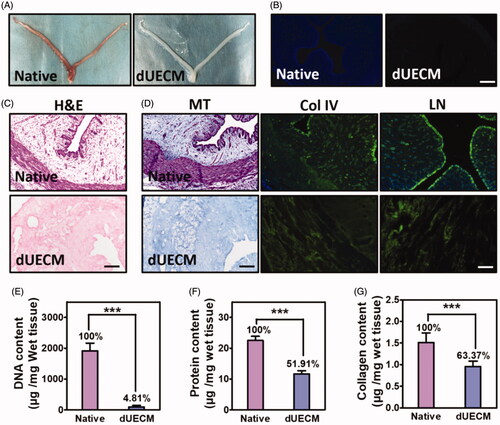
Figure 2. Morphology of non, glutaraldehyde (GA), procyanidin (PC) and genipin (GP) crosslinked dUECM by macroscopic inspection (A) and SEM (B). Native: native uterus; dUECM: decellularized rabbit uterus. The scale bar represents 30 μm.
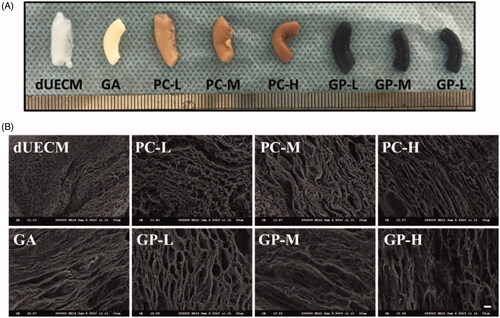
Figure 3. The degradation rate of PC-crosslinked (A,B) and GP-crosslinked (C,D) dUECM after in collagenase-IV solution over 48 h (A,C) and 4 h (B,D). ***, p < .001.
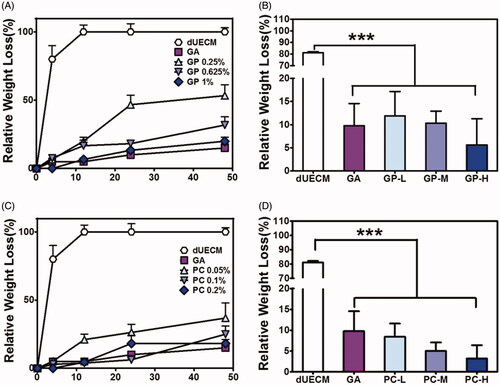
Figure 4. In vitro biocompatibility of crosslinked dUECM. (A) The viability of HUVECs in the lixivia of different scaffolds based on the MTT assay. (B) The number of residual cells on non-, GA- PC- and GP-crosslinked dUECM. (C) SEM micrographs of HUVECs cells incubated with different concentrations of non-, GA-, PC- and GP-crosslinked dUECM for 48 h. The arrows point to the cells that adhere to the immersed dUECM. The scale bar represents 30 μm. *, p < .05; ***, p < .001.
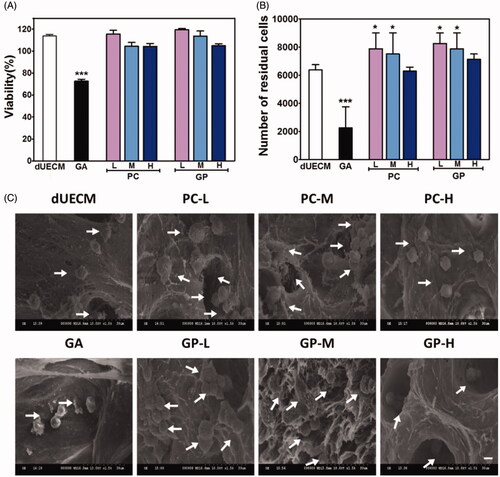
Figure 5. Characterisation of non- and crosslinked dUECM after subcutaneous xenogeneic implants experiment. The relative weight loss after subcutaneously embedding of dUECM samples after 7 days (A) and 14 days (B). Morphological results (C) and H&E staining after 14 days of subcutaneous embedding experiment (D). The black scale bars represent 100 μm and the blue scale bars represent 10 μm. ***, p < .001.
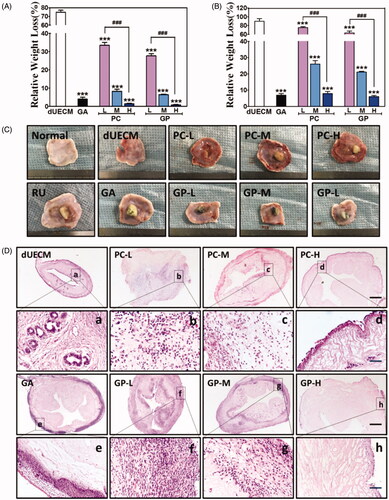
Figure 6. Immunohistochemical staining of CD68 (A,C) and TNF-α (B,D) after subcutaneous embedding experiment (14 days). The Scale bar represents 100 μm. RU: native rabbit uterus.
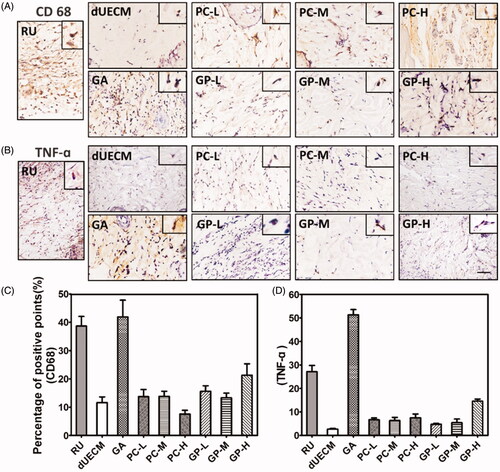
Figure 7. In vivo evaluation of crosslinked dECM for uterus regeneration and construction in a xenogeneic rat model. Dotted lines indicate repair sites.
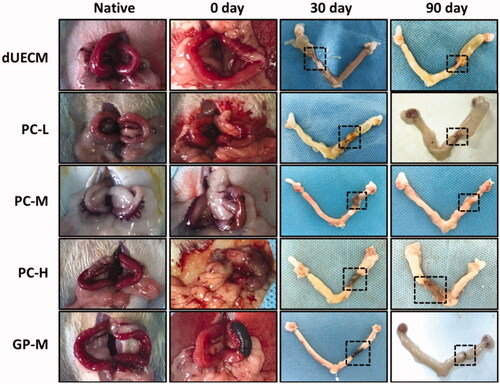
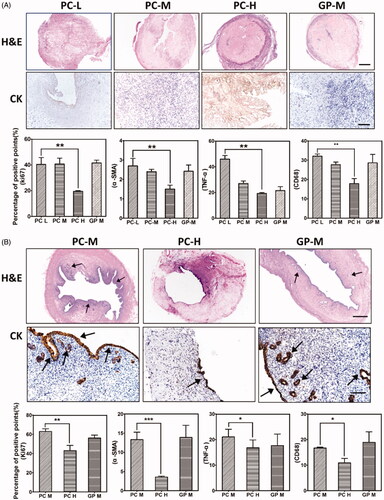
Figure 8. H&E and immunohistochemical staining of CK, Ki67, ɑ-SMA, TNF-ɑ, and CD68 after transplantation at 30 days (A) and 90 days (B). The scale bar represents 100 μm. ***, p < .001.