
Figures & data
Figure 1. Expression of PTENP1 in cervical cancer tissues and cells. (A) qRT-PCR on expression of PTENP1 in cervical cancer and adjacent normal tissues; (B) qRT-PCR on expression of PTENP1 in HeLa, SiHa, C33A, CasKi and H8 cells; (C) The level of PTENP1 in cytoplasm was higher than that in nucleus in subcellular fractionations; (D) Overexpression of PTENP1 in CasKi and HeLa cells was successfully established; **compared with adjacent normal tissues, p < .01; *compared with H8 cells, or blank group, p < .05
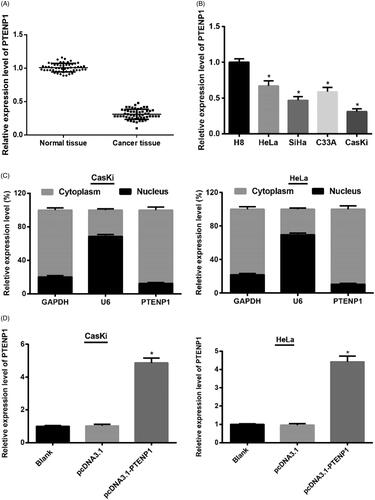
Table 1. Association between PTENP1 expression and clinicopathological features of patients with cervical cancer.
Figure 2. CCK-8 assay and FCM on over-expression of PTENP1 on cell proliferation and apoptosis on CasKi and HeLa cells. (A,B) CCK-8 assay. Decreased cell proliferation in CasKi and Hela cells in pcDNA3.1-PTENP1 group; (C) Increased cell apoptosis in pcDNA3.1-PTENP1 group in both CasKi and HeLa cells; *compared with blank group, p < .05
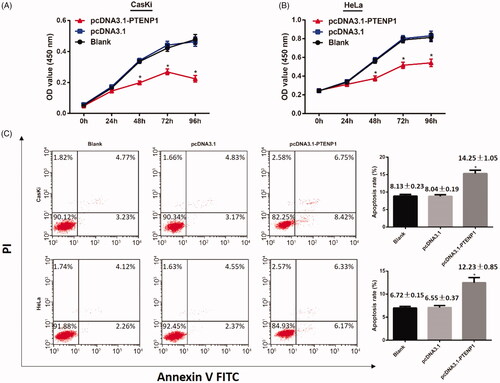
Figure 3. Over-expression of PTENP1 on EMT biomarkers in CasKi and HeLa cells. (A) cell morphology of CasKi and HeLa cells under an inverted microscope (×100); (B) qRT-PCR showed decreased mRNA expression of ZEB1 and Snail in cells of pcDNA3.1-PTENP1 group; (C) elevated expression of E-cadherin and decreased expression of Vimentin in cells of pcDNA3.1-PTENP1 group; (D) Immunofluorescence showed overexpressed E-cadherin and reduced Vimentin in pcDNA3.1-PTENP1 group; *compared with blank group, p < .05
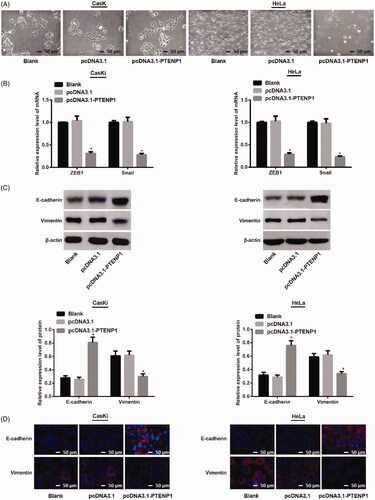
Figure 4. miR-106b overexpressed in both cervical cancer tissues and cells. (A,B) qRT-PCR showed increased expression of miR-106b in cervical cancer tissues and cervical cancer cells; (C,D) decreased expression of miR-106b in miR-106b inhibitors group of CasKi and Hela cells; **compared with adjacent normal tissues, p < .01; *compared with H8 cells, or blank group, p < .05
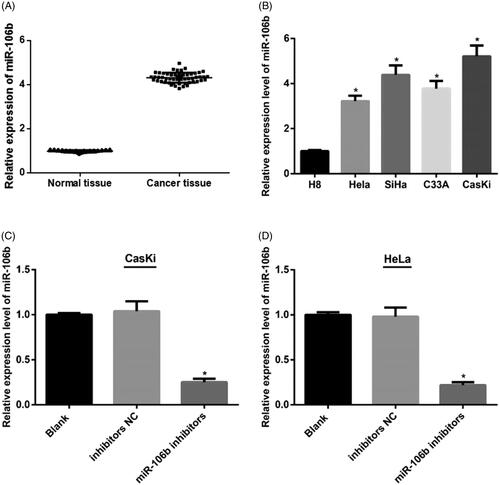
Figure 5. miR-106 on cell proliferation and cell apoptosis in CasKi and HeLa cells. (A,B) CCK-8 assay showed down-regulation of miR-106 inhibits cell proliferation of CasKi and HeLa cells; (C) Cell apoptosis in CasKi cells and HeLa cells detected by FCM; *compared with blank group, p < .05
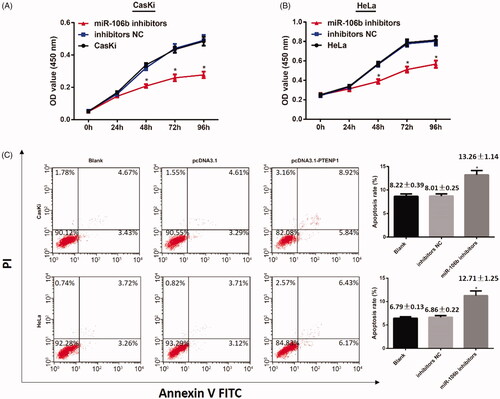
Figure 6. Down-regulation of miR-106b on EMT biomarkers in CasKi and HeLa cells. (A) cell morphology of CasKi and HeLa cells under an inverted microscope (×100); (B) qRT-PCR showed decreased mRNA expressions of ZEB1 and Snail in miR-106b inhibitors group; (C) Western blotting showed cells in miR-106b inhibitors group had elevated expression of E-cadherin, and decreased expression of vimentin; (D) Immunofluorescence showed E-cadherin overexpressed in miR-106b inhibitors group and vimentin reduced in miR-106b inhibitors group; *compared with blank group, p <.05
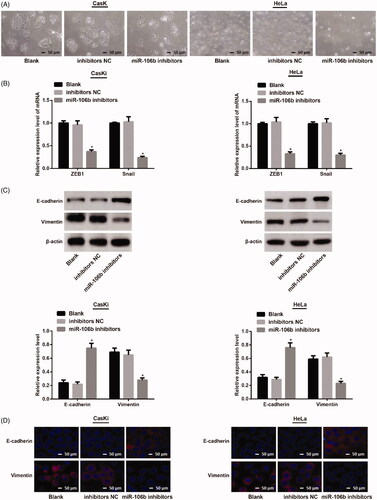
Figure 7. Cell proliferation, cell apoptosis and EMT of CasKi and HeLa cells. (A) CCK-8 assay showed increased cell proliferation in pcDNA3.1-PTENP1 + miR-106b mimics group; (B) FCM showed inhibited cell apoptosis in pcDNA3.1-PTENP1 + miR-106b mimics group; (C) Cell morphology of CasKi and HeLa cells in each group (×100); (D) increased mRNA expressions of ZEB1 and Snail in pcDNA3.1-PTENP1 + miR-106b mimics group; (E) decreased expression of E-cadherin, and increased expression of Vimentin in pcDNA3.1-PTENP1 + miR-106b mimics group; (F) Immunofluorescence staining showed decreased E-cadherin and increased Vimentin in pcDNA3.1-PTENP1 + miR-106b mimics group (×200); *compared with pcDNA3.1-PTENP1 + mimics NC group, p < .05
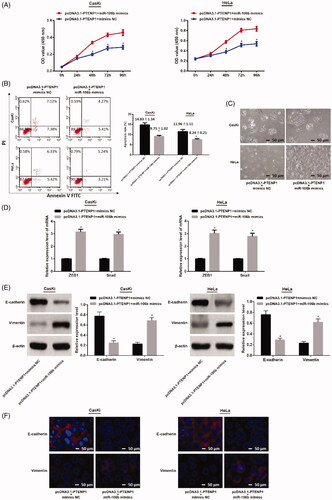
Figure 8. mRNA (A,C,E,G) and protein expression (B,D,F,H) of PTEN in both cervical cancer tissues and cells. *compared with adjacent normal tissues, or H8 cells or blank group, p <.05.
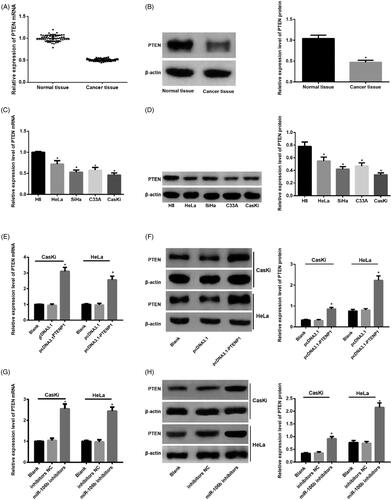
Figure 9. Binding relationship of PTENP1 with miR-106b and the target relationship between miR-106b and PTEN. (A) reduced expression of miR-106b in in pcDNA3.1-PTENP1 group of both CasKi cells and HeLa cells; (B) increased expression of PTENP1 in miR-106b inhibitors group of both CasKi cells and HeLa cells; (C) Online software showed binding relationship of PTENP1 with miR-106b in both CasKi cells and HeLa cells; (D) RNA-pull down assay showed binding relationship of PTENP1 with miR-106b in both CasKi cells and HeLa cells; (E) online software and luciferase activity assay confirmed the targeting relationship between miR-106b and PTEN; *compared with blank group, or NC group, p < .05.
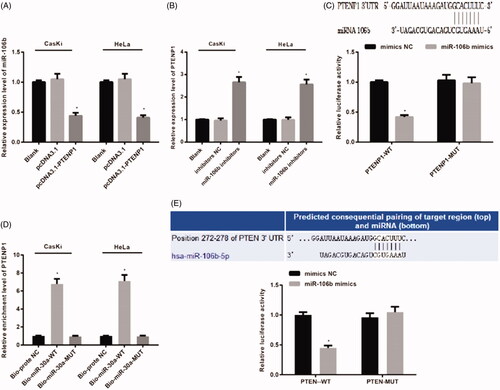
Table 2. Primer sequences for qRT-PCR.