Figures & data
Figure 1. TA I inhibits the proliferation of HepG2, Huh7, and L02 cells. The growth inhibitory effect of TA I was measured using the CCK-8 assay. (A) Cell viability was observed after treatment with TA I (0, 2, 4, 6, 8, and 10 μM) for 24 h in HepG2 cells. (B) Cell viability was observed after treatment with TA I (0, 2, 4, 6, 8, and 10 μM) for 24 h in Huh7 cells. (C) Cell viability was observed after treatment with TA I (0, 2, 4, 8, 16, and 32 μM) for 24 h in L02 cells. Data are presented as means ± standard deviations of three separate experiments. *p < .05, ***p < .001, ****p < .0001. TA: tanshinone; CCK-8: cell counting Kit-8.
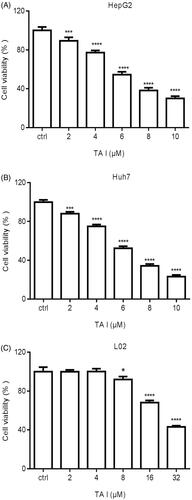
Figure 2. Effects of TA I on cell cycle distribution in HepG2 and Huh7 cells. (A) HepG2 and Huh7 cells were treated with TA I (0, 2, 4, and 6 μM) for 24 h, and cell cycle distribution was analyzed by flow cytometry. (B) Bar graphs show the quantification of cell cycle distribution in HepG2 and Huh7 cells. (C) HepG2 and Huh7 cells were treated with TA I (0, 2, 4, and 6 μM) for 12 h, and the protein expression levels of cyclin D1 and p21 were assayed by western blot. β-actin served as a loading control. **p < .01, ***p < .001, ****p < .0001. TA: tanshinone.
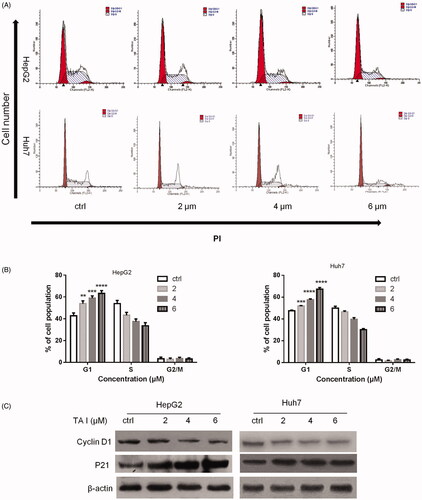
Figure 3. Effects of TA I on cell apoptosis in HepG2 and Huh7 cells. (A) HepG2 and Huh7 cells were treated with TA I (0, 2, 4, and 6 μM) for 24 h, and cell apoptosis was analyzed by flow cytometry. (B) Bar graphs show the quantification of apoptosis in HepG2 and Huh7 cells. (C) HepG2 and Huh7 cells were treated with TA I (0, 2, 4, and 6 μM) for 12 h, and the protein expression level of cleaved PARP was assayed by western blot. β-actin served as a loading control. *p < .05, ***p < .001, ****p < .0001. TA: tanshinone; PARP: poly(ADP-ribose) polymerase.
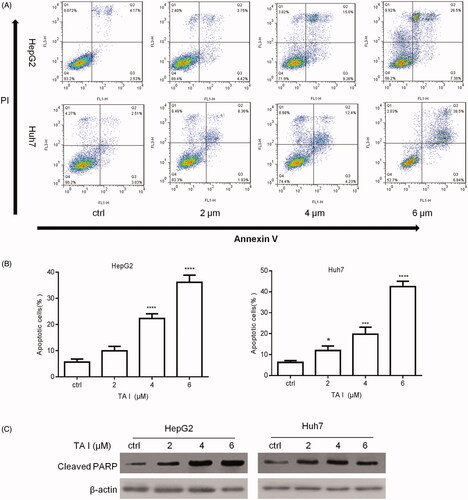
Figure 4. TA I promotes apoptosis in HepG2 and Huh7 cells by inhibiting autophagy through suppressing the p53/DRAM signaling pathway. (A) HepG2 and Huh7 cells were treated with TA I (0, 2, 4, and 6 μM) for 12 h, and the protein expression levels of LC3B and beclin-1 were detected by western blot. (B) HepG2 and Huh7 cells were treated with TA I (0, 2, 4, and 6 μM) for 12 h, and the protein expression levels of p53 and DRAM were detected by western blot. (C) HepG2 and Huh7 cells were pre-treated with 3-MA (2 mM) for 1 h, and then incubated with TA I (4 µM) for 24 h. Cell viability was examined by CCK-8 assay. **p < .01, ***p < .001. TA: tanshinone; DRAM: damage-regulated autophagy modulator; 3-MA: 3-methyladenine; CCK-8: cell counting Kit-8.
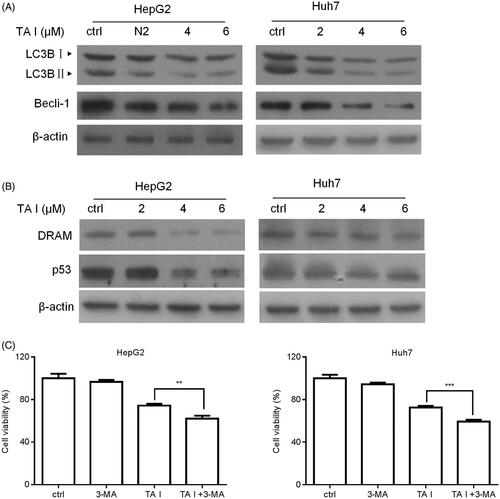
Figure 5. TA I promotes apoptosis in HepG2 and Huh7 cells via ROS production. (A) HepG2 and Huh7 cells were treated with TA I (0, 2, 4, and 6 μM) for 12 h, and ROS levels were detected by flow cytometry. (B) Bar graphs show the quantification of ROS levels in HepG2 and Huh7 cells. (C) HepG2 and Huh7 cells were pre-treated with NAC (4 mM) for 1 h, and then incubated with TA I (4 µM) for 24 h. Cell viability was examined by CCK-8 assay. *p < .05, **p < .01, ***p < .001, ****p < .0001. TA: tanshinone; ROS: reactive oxygen species; NAC: N-acetyl-cysteine; CCK-8: cell counting Kit-8.
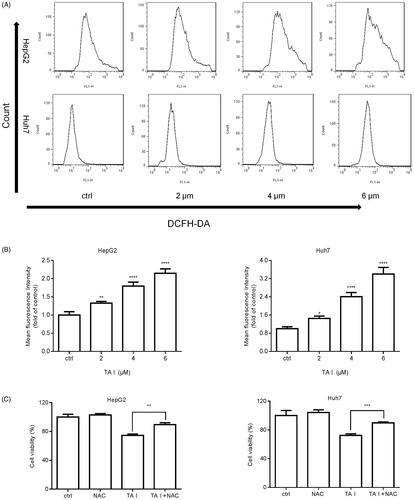
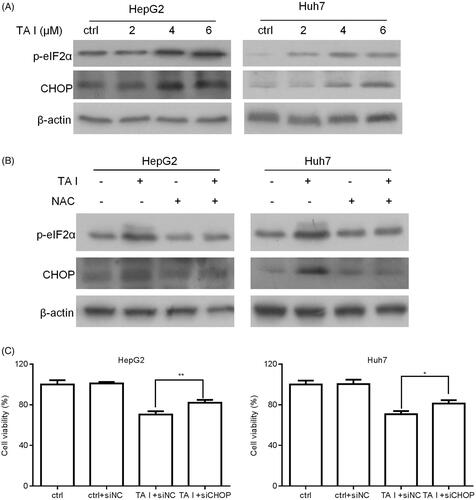
Figure 6. TA I promotes apoptosis in HepG2 and Huh7 cells by activating ER stress through ROS generation. (A) HepG2 and Huh7 cells were treated with TA I (0, 2, 4, and 6 μM) for 12 h, and the expression levels of phospho-eIF2α and CHOP proteins were assayed by western blot. (B) HepG2 and Huh7 cells were pre-treated with NAC (4 mM) for 1 h, and then incubated with TA I (4 µM) for 12 h; the expression levels of phospho-eIF2α and CHOP proteins were assayed by western blot. β-actin served as a loading control. (C) HepG2 and Huh7 cells were transfected with or without siNC or siCHOP for 48 h and then incubated with or without TA I (4 µM) for 24 h. The cell viability was measured using the CCK-8 assay. *p < .05, **p < .01. TA: tanshinone; ER: endoplasmic reticulum; ROS: reactive oxygen species; NAC: N-acetyl-cysteine; siRNA: control siRNA; CCK-8: cell counting Kit-8.