Figures & data
Figure 1. H2O2 evoked oxidative stress damage in HaCaT cells. (A) HaCaT cells were stimulated with various doses of H2O2 for 12 h. The viability of HaCaT cells was examined by CCK-8. The following experiments applied 300 μM H2O2 in HaCaT cells. (B) Expression of p53 and p16, (C) apoptosis rate, (D) expression of Bax, Cleaved-Caspase-3 and Cleaved-PARP, as well as (E) ROS level were examined by Western blot, FITC-PI double staining, and DCFH-DA probe. ** and *** indicate p-values less than .01 and .001.
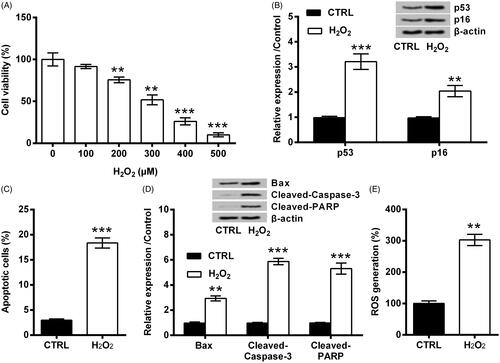
Figure 2. cZNF609 expression induced by H2O2 in HaCaT cells. HaCaT cells were stimulated with 300 μM H2O2 for 12 h. cZNF609 level was checked by qRT-PCR. ** indicates p-value less than .01.
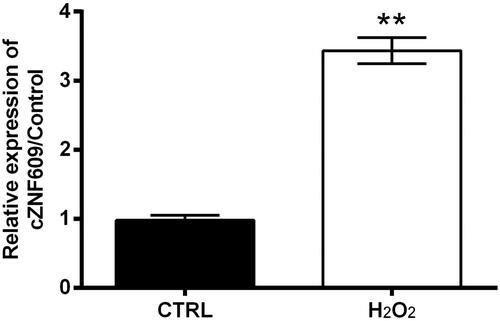
Figure 3. cZNF609 silence alleviated H2O2-evoked oxidative stress damage in HaCaT cells. (A) si-NC or si-cZNF609 was transfected into HaCaT cells. cZNF609 level was checked by qRT-PCR. Following transfection, the cells were stimulated with 300 μM H2O2 for 12 h. (B) Cell viability, (C,D) expression of p53 and p16, (E) apoptosis rate, (F,G) expression of Bax, Cleaved-Caspase-3 and Cleaved-PARP, as well as (H) ROS level were examined by CCK-8, Western blot, FITC-PI double staining, and DCFH-DA probe. *, ** and *** indicate p-values less than .05, .01 and .001.
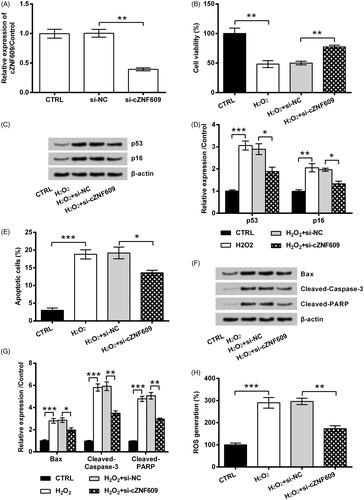
Figure 4. cZNF609 silence induced miR-145 up-regulation. Following transfection with si-NC or si-cZNF609, HaCaT cells were stimulated with 300 μM H2O2 for 12 h. miR-145 level was checked by qRT-PCR. * and *** indicate p-values less than .05 and .001.
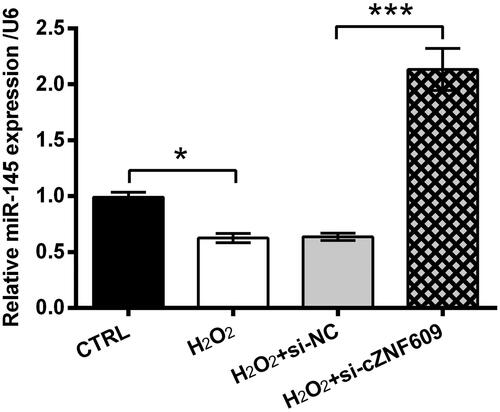
Figure 5. cZNF609 silence alleviated oxidative stress damage through miR-145. (A) NC or miR-145 inhibitor was transfected into HaCaT cells. miR-145 level was checked by qRT-PCR. The cells were transfected with si-cZNF609 alone or together with miR-145 inhibitor. si-NC and NC were transfected as negative controls. The transfected cells were then stimulated with 300 μM H2O2 for 12 h. (B) Cell viability, (C,D) expression of p53 and p16, (E) apoptosis rate, (F,G) expression of Bax, Cleaved-Caspase-3 and Cleaved-PARP, as well as (H) ROS level were examined by CCK-8, Western blot, FITC-PI double staining, and DCFH-DA probe. *, ** and *** indicate p-values less than .05, .01 and .001.
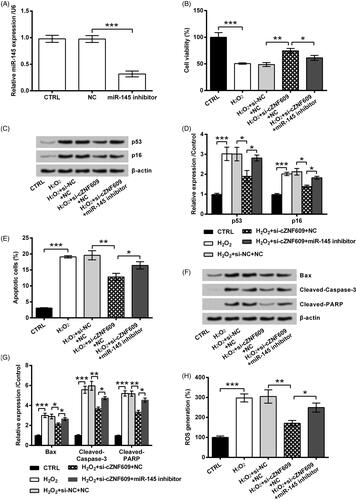
Figure 6. The decrease of miR-145 promoted cZNF609 expression. The cells were transfected with si-cZNF609 alone or together with miR-145 inhibitor. si-NC and NC were transfected as negative controls. The transfected cells were then stimulated with 300 μM H2O2 for 12 h. (A) cZNF609 and (B) miR-145 expression was tested by qRT-PCR. *, ** and *** indicate p-values less than .05, .01 and .001.
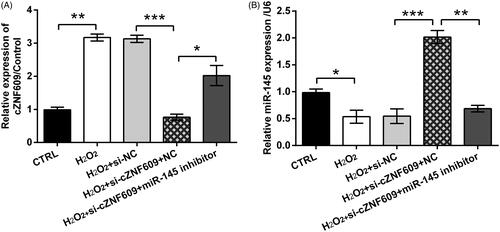
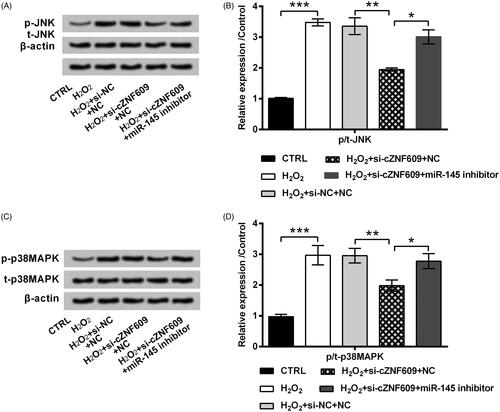
Figure 7. cZNF609 silence inhibited JNK and p38MAPK pathways through miR-145. HaCaT cells were transfected with si-cZNF609 alone or together with miR-145 inhibitor. si-NC and NC were transfected as negative controls. The transfected cells were then stimulated with 300 μM H2O2 for 12 h. The activation of (A,B) JNK and (C,D) p38MAPK was checked by Western blot. *, ** and *** indicate p-values less than .05, .01 and .001.