Figures & data
Figure 1. Chemical structure of celastrol.
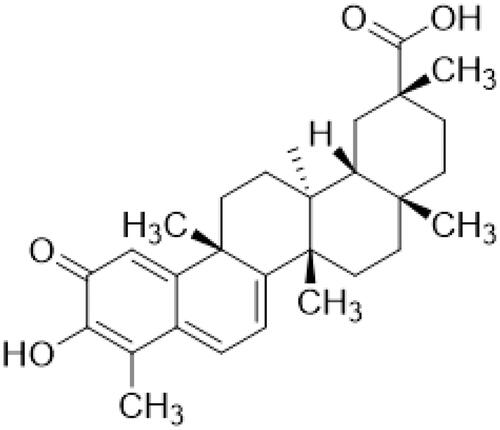
Figure 2. Tripterygium wilfordii.
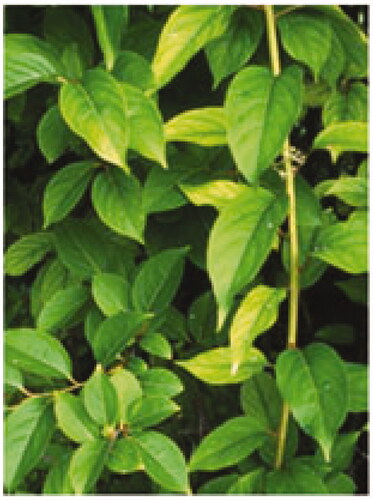
Figure 3. Dioxygen activation by PVP-induced charge transfer.
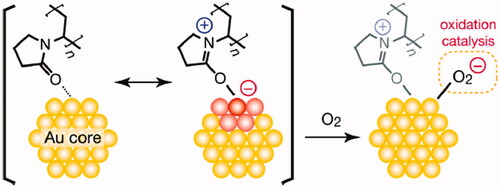
Figure 4. Chemical structure of celastrol AuNP (CA).
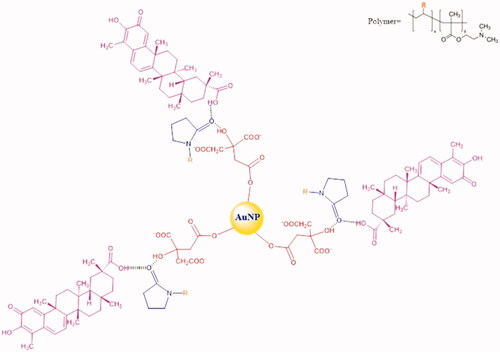
Figure 5. Chemical structure of folate receptor targeted celastrol AuNP (FCA).
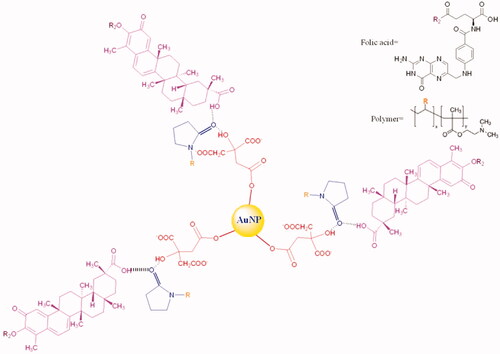
Figure 6. UV–Vis spectra of gold nanoparticle (AuNP), folic acid, celastrol, celastrol AuNP (CA), and folate receptor targeted celastrol AuNP (FCA).
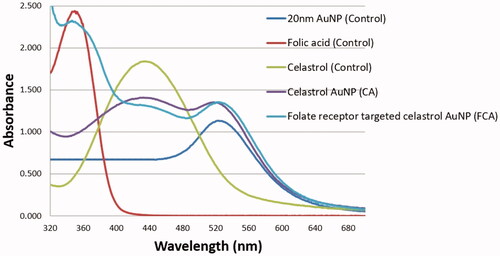
Figure 7. TEM image of gold nanoparticle (AuNP). Scale bar = 200 nm.
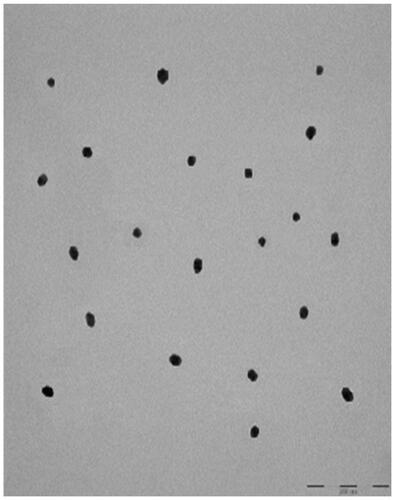
Figure 8. TEM image of celastrol AuNP (CA). Scale bar = 200 nm.
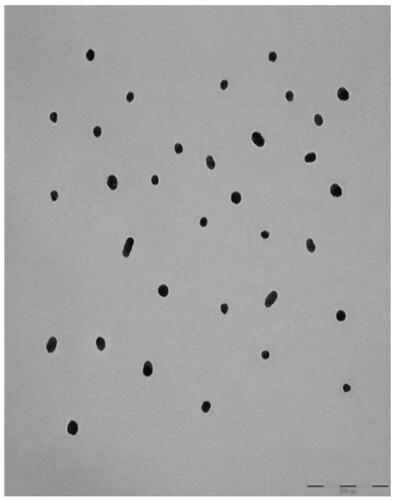
Figure 9. TEM image of folate receptor targeted celastrol AuNP (FCA). Scale bar = 200 nm.
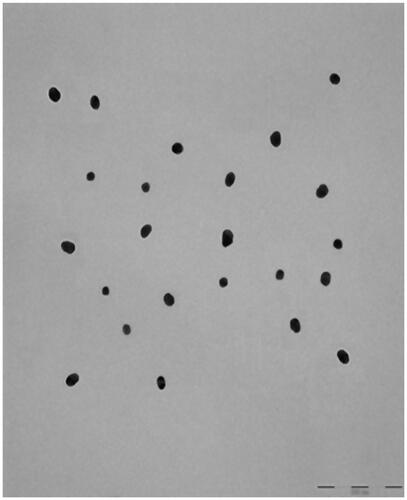
Figure 10. Nanoparticle size of gold (AuNP).
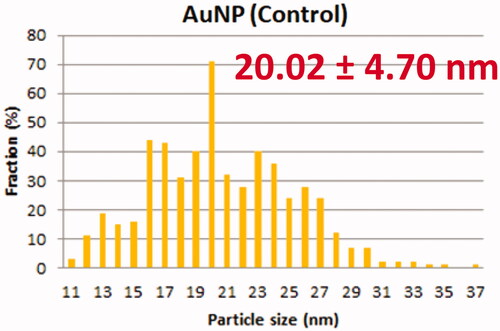
Figure 11. Nanoparticle size of celastrol AuNP (CA).
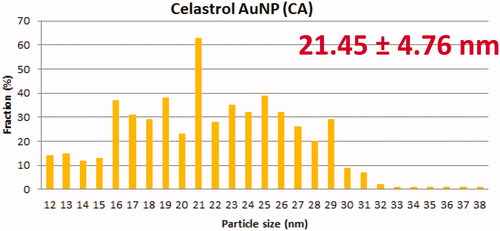
Figure 12. Nanoparticle size of folate receptor targeted celastrol AuNP (FCA).
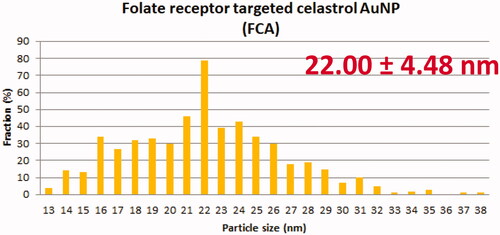
Figure 13. Polar amide group, apolar methylene and methine groups in PVP-co-2-dimethylaminoethyl methacrylate (PVP) backbone.
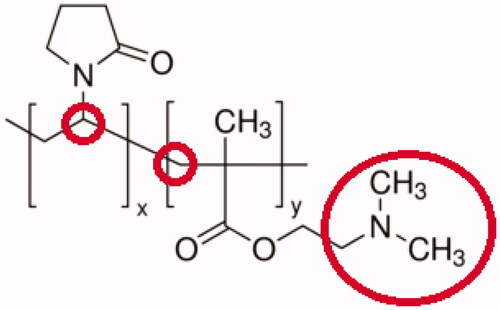
Figure 14. Solubility of celastrol, celastrol AuNP (CA) and folate receptor targeted celastrol AuNP (FCA) in double distilled water (DDW), phosphate-buffered saline (PBS; 50 mM, pH 7.4) and Dulbecco’s Modified Eagle Medium (DMEM).
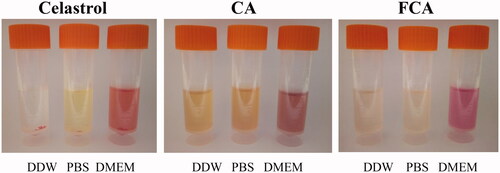
Figure 15. A standard curve for the absorbance values versus the corresponding celastrol concentrations.
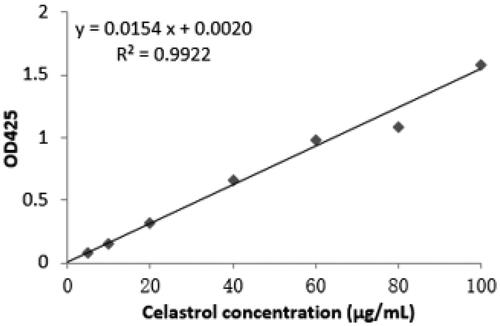
Figure 16. A standard curve for the absorbance values versus the corresponding folate receptor targeted celastrol AuNP (FCA) concentrations.
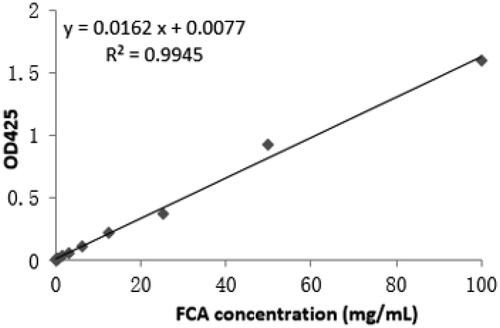
Figure 17. In vitro folate receptor targeted celastrol AuNP (FCA) release profiles.
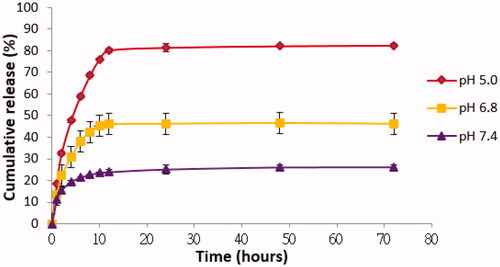
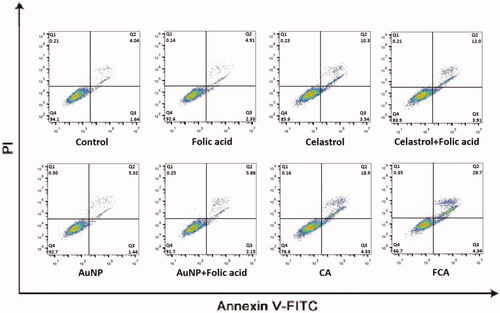
Figure 18. Flow cytometry quantitative analysis for control group, folic acid treatment group, celastrol treatment group, gold nanoparticle (AuNP) treatment group, folate receptor targeted celastrol AuNP and folic acid (FCA-FA) treatment group, celastrol AuNP (CA) treatment group and folate receptor targeted celastrol AuNP (FCA) treatment group.
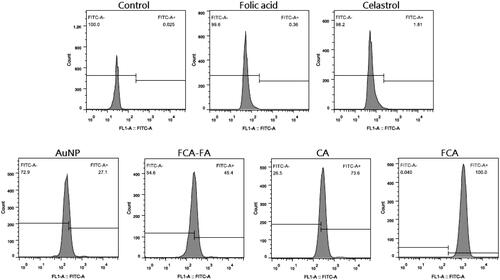
Figure 19. Breast cancer MCF-7 cells alone (Control).
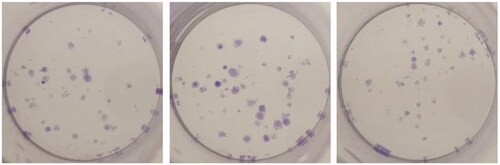
Figure 20. Folic acid treatment group.
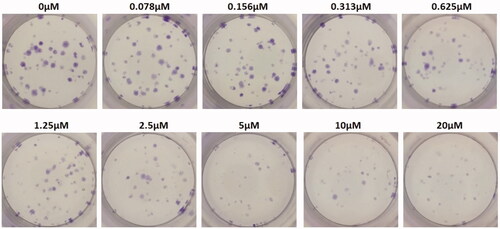
Figure 21. Celastrol treatment group.
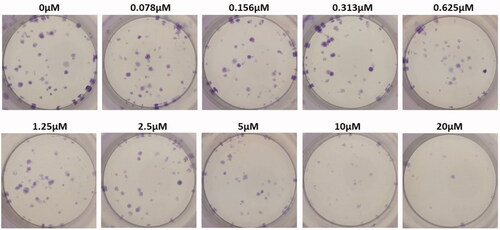
Figure 22. Gold nanoparticle (AuNP) treatment group.
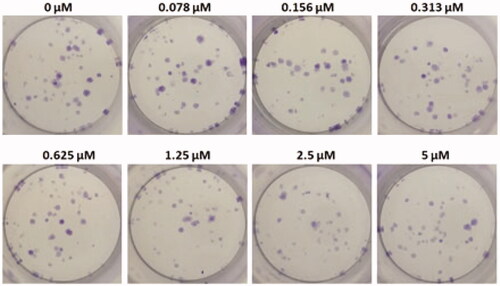
Figure 23. Celastrol AuNP (CA) treatment group.
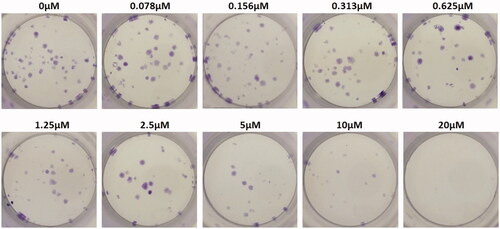
Figure 24. Folate receptor targeted celastrol AuNP (FCA) treatment group.
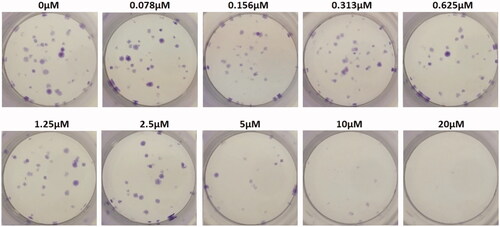
Figure 25. Colon forming efficiency of breast cancer MCF-7 cells in folic acid treatment group at the concentrations from 0 to 20 μM. Data were expressed as mean SD (n = 3), *P < 0.05 versus control, one-way ANOVA.
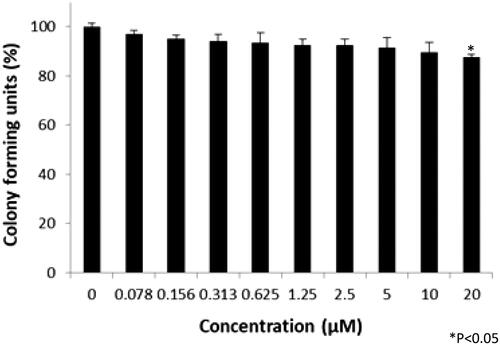
Figure 26. Colon forming efficiency of breast cancer MCF-7 cells in gold nanoparticle (AuNP) treatment group at the concentrations from 0 to 20 μM. Data were expressed as mean SD (n = 3), *P < 0.05 versus control, one-way ANOVA.
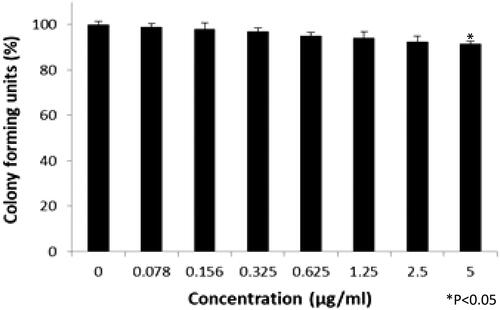
Figure 27. Colon forming efficiency of breast cancer MCF-7 cells in celastrol treatment group at the concentrations from 0 to 20 μM. Data were expressed as mean SD (n = 3), *P < 0.05 versus control, one-way ANOVA.
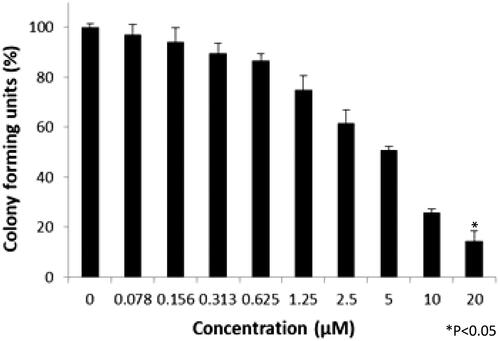
Figure 28. Colon forming efficiency of breast cancer MCF-7 cells in celastrol AuNP (CA) treatment group at the concentrations from 0 to 20 μM. Data were expressed as mean SD (n = 3), *P < 0.05 versus control, one-way ANOVA.
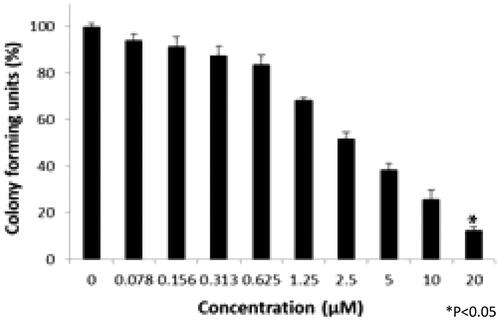
Figure 29. Colon forming efficiency of breast cancer MCF-7 cells in folate receptor targeted celastrol AuNP (FCA) treatment group at the concentrations from 0 to 20 μM. Data were expressed as mean SD (n = 3), *P < 0.05 versus control, one-way ANOVA.
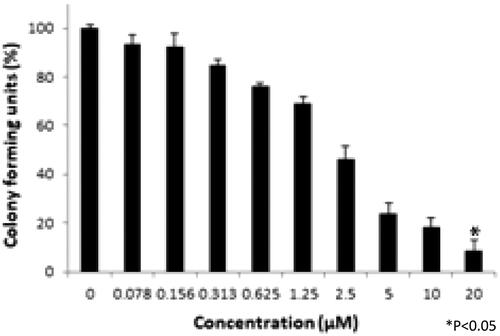
Figure 30. Cell apoptosis of MCF-7 breast cancer cells in the control treatment group, celastrol treatment group, folic acid treatment group, AuNP treatment group, CA treatment group and FCA treatment group.
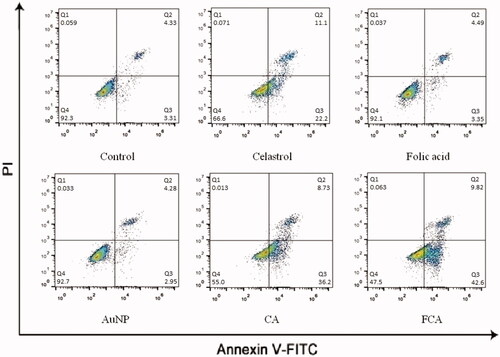
Figure 31. Nuclear staining with Hoechst 33342 staining in the breast cancer MCF-7 cells. (1) Control treatment group, (2) folic acid treatment group, (3) celastrol treatment group, (4) AuNP treatment group, (5) CA treatment group, and (6) FCA treatment group. Scale bars = 50 μm.
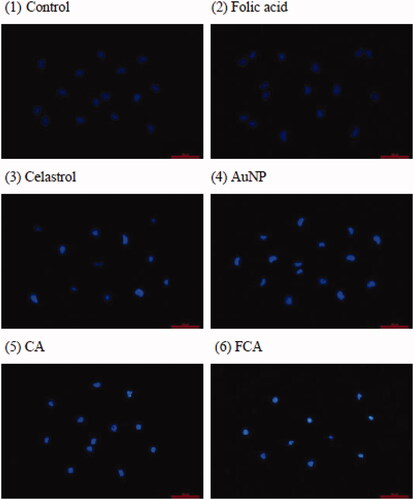
Figure 32. Flow cytometry analysis of MMP in breast cancer MCF-7 cells for the control treatment group, celastrol treatment group, folic acid treatment group, AuNP treatment group, CA treatment group and FCA treatment group.
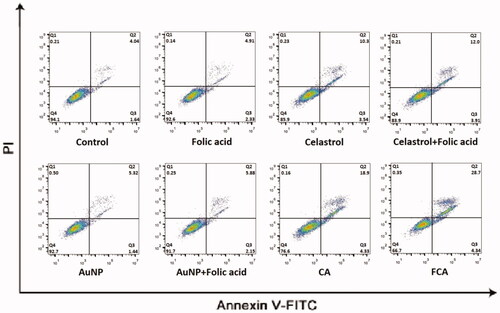
Figure 33. Control treatment group for 3D tumour spheroid. Scale bar = 100 μm.
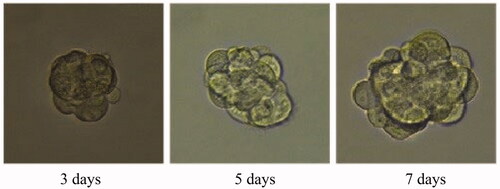
Figure 34. Folic acid treatment group for 3D tumour spheroid. Scale bar = 100 μm.
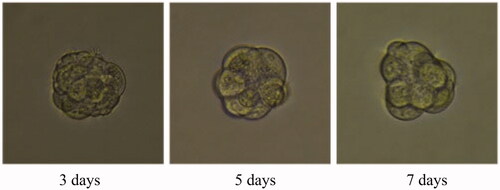
Figure 35. Gold nanoparticle (AuNP) treatment group for 3D tumour spheroid. Scale bar = 100 μm.
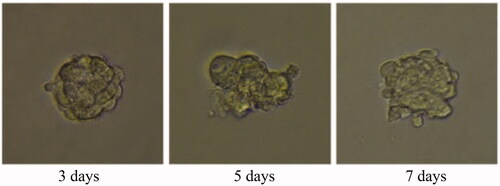
Figure 36. Gold nanoparticle (AuNP) and folic acid treatment group for 3D tumour spheroid. Scale bar = 100 μm.
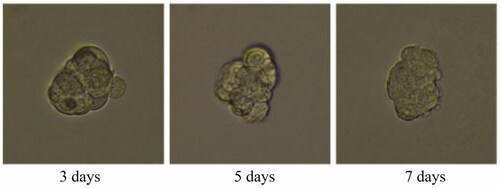
Figure 37. Celastrol treatment group for 3D tumour spheroid. Scale bar = 100 μm.
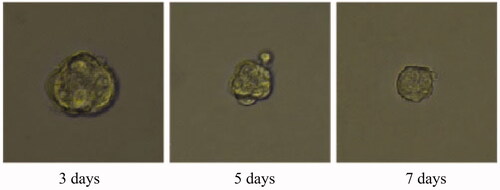
Figure 38. Celastrol and folic acid treatment group for 3D tumour spheroid. Scale bar = 100 μm.
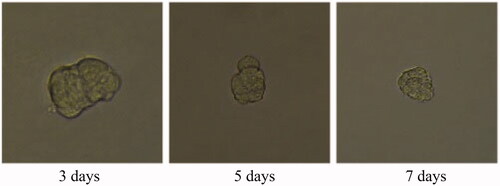
Figure 39. Celastrol AuNP (CA) treatment group for 3D tumour spheroid. Scale bar = 100 μm.
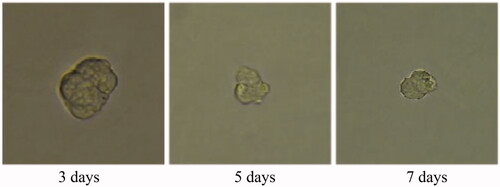
Figure 40. Folate receptor targeted celastrol AuNP (FCA) treatment group for 3D tumour spheroid. Scale bar = 100 μm.
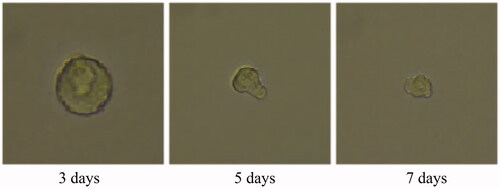
Figure 41. Cell apoptosis of 3D tumour spheroid in the control treatment group, folic acid treatment group, celastrol treatment group, celastrol and folic acid treatment group, AuNP treatment, AuNP and folic acid treatment, CA treatment treatment group and FCA treatment group.