Figures & data
Table 1. Primer designs.
Figure 1. (a). Morphological differences between A549 and A549-T cells were observed under a microscope after 48 h of paclitaxel incubation. (b) In 24–48 h, the growth rate of A549-T was slightly higher than that of A549, and there was no significant difference in overall cell growth rate. (c) The x-axis shows the logarithm value of the drug concentration, and the y-axis shows the inhibition rate of the cells. The inhibition rates of A549 and A549-T cells at different concentrations are plotted. (d) An A549 paclitaxel resistant strain (A549-T) was successfully developed in vitro and its resistance index (RI) was 2.63. ***p < .001 (Student’s t-test).
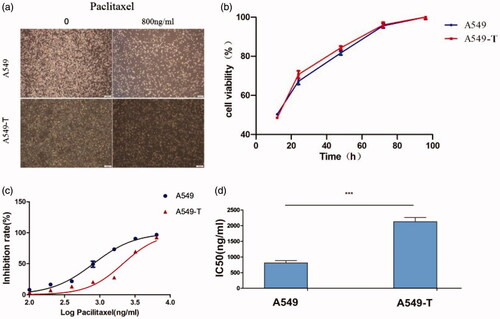
Figure 2. Differential gene identification and target gene expression verification by qRT-PCR. (a) Each dot in the volcano map represents a gene, with red dots representing up-regulated genes, green dots representing down-regulated genes, and black dots representing genes with no significant change in expression. The x-axis shows the difference in the expression level of the genes, while the y-axis shows the significance of the gene expression level. (b) The x-axis shows log2 (FPKM), which is the log value of the average expression quantity in the two samples. The y-axis shows log2 (FC), which is the logarithm of the multiple of gene expression differences between two samples, and is used to measure the difference in expression levels. (c) qRT-PCR was used to verify the expression of six candidate genes identified by methylation analysis and RNA-Seq, that may lead to drug resistance. Log 2 FC/RQ is the logarithm of the fold change or relative quantity in base 2. Error bars represent the standard deviation (STDEV) of the qRT-PCR analysis (n = 3).
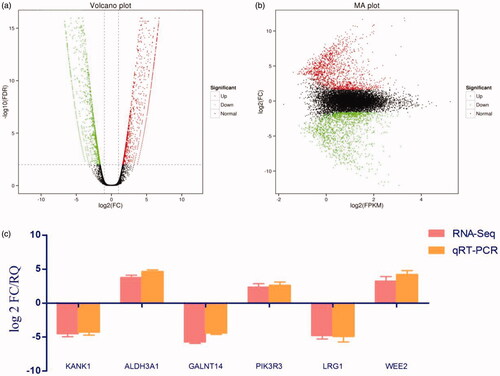
Table 2. Correlation screening indexes of genes with methylation and expression differences.
Figure 3. Silencing KANK1 reduced the sensitivity of A549 lung adenocarcinoma cells to PTX. (a) Screening of the efficiency of interference of three SiRNAs in KANK1. GAPDH was used as the internal control. (b) Drug sensitivity of A549 cells transfected with SiKANK1 or SiNC. (c) IC50 of PTX in KANK1-homo-3251-treated A549 cells. Each experiment was performed in triplicate. *** p < .001 (Student’s t-test).
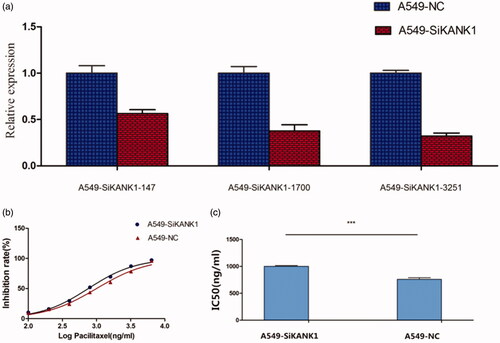
Figure 4. Knockdown of KANK1 decreased apoptosis and increased migration of A549 cells, thereby increasing the resistance of A549 cells to PTX drugs. (a) Flow cytometry analysis showed that the knockdown of KANK1 reduced the rate of apoptosis. Different concentrations of paclitaxel led to different apoptosis rates. (b) In vitro migration experiments showed that KANK1 silencing increased the migration capacity of A549 cells. *p < .05, **p < .01, ***p < .001 (Student’s t-test).
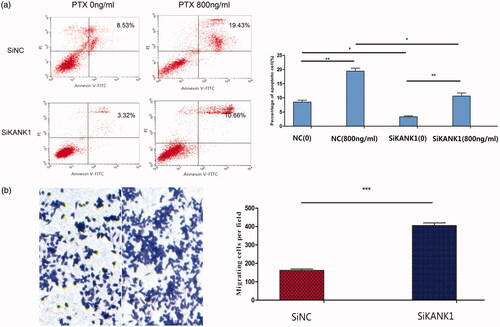
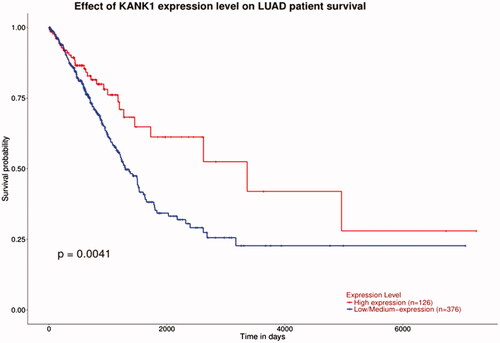
Figure 5. Correlation of KANK1 expression and the DFS of patients with lung adenocarcinoma. Red and blue lines indicate high and low expression groups, respectively. High expression of KANK1 is associated with improved DFS. p < .05 was considered to be statistically significant.