Figures & data
Figure 1. The neighbour-joining (NJ) tree based on 16S rRNA gene sequence analysis showing phylogenetic relationships of strain MAH-11 with related species. Bootstrap values more than 70% based on 1000 replications are shown at branching points. Scale bar, 0.05 substitutions per nucleotide position.

Table 1. Biochemical characterization of Sphingobium sp. MAH-11.
Figure 2. R2A broth with AgNO3 as control (A), biosynthesized AgNPs (B), UV–vis spectra (C), FE-TEM images (D and E) and histogram of different sizes of biosynthesized AgNPs (F).
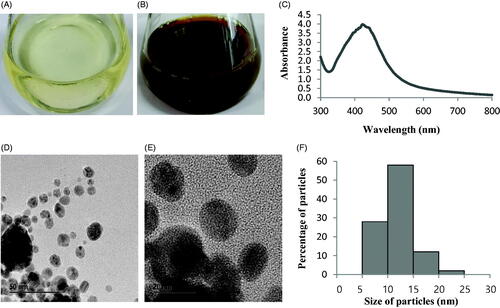
Figure 3. EDX spectrum of biosynthesized AgNPs (A), TEM image (electron micrograph region) used for mapping (B) and distribution of silver in the elemental mapping (C).
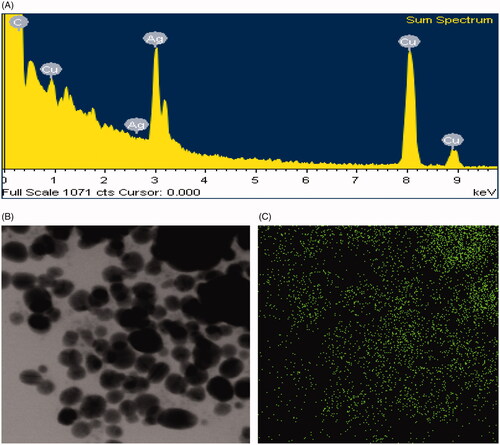
Figure 4. X-ray diffraction pattern (A) and SAED pattern (B) of biosynthesized AgNPs.
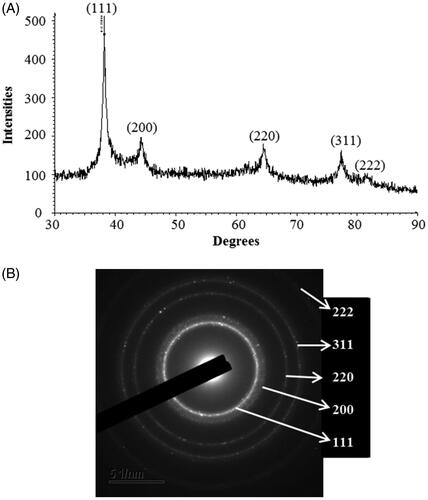
Figure 5. FT-IR spectra of biosynthesized AgNPs (A), bacterial culture supernatant (B) and silver nitrate (C).
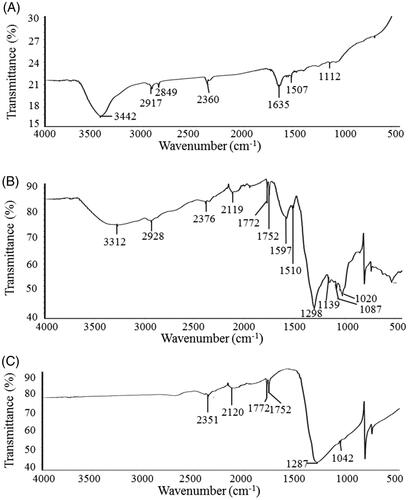
Figure 6. Particles size distribution of biosynthesized AgNPs according to intensity (A), number (B) and volume (C).
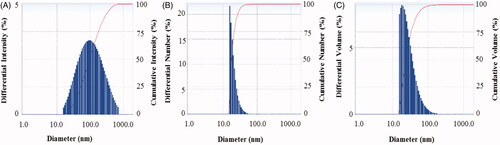
Figure 7. Zones of inhibition of biosynthesized AgNPs (30 μL) at 500 ppm and 1000 ppm concentrations in the water against P. aeruginosa, E. coli and S. aureus.
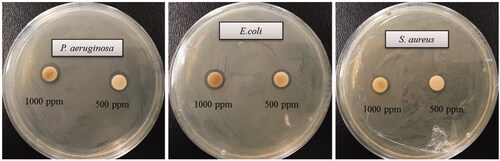
Figure 8. Zones of inhibition of commercial antibiotics against P. aeruginosa, E. coli and S. aureus. Abbreviation. E (erythromycin, 15 μg/disc), P (penicillin, G 10 μg/disc) and VA (vancomycin, 30 μg/disc).
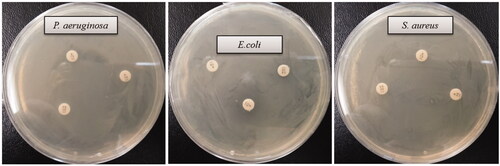
Table 2. Antimicrobial activity of biosynthesized AgNPs against P. aeruginosa, E. coli and S. aureus.
Table 3. Antimicrobial activity of commercial antibiotics against P. aeruginosa, E.coli and S. aureus. -: No zone of inhibition.
Figure 9. Growth curves of E. coli (A) and S. aureus (B) cultured in R2A broth with different concentrations of the biosynthesized AgNPs.
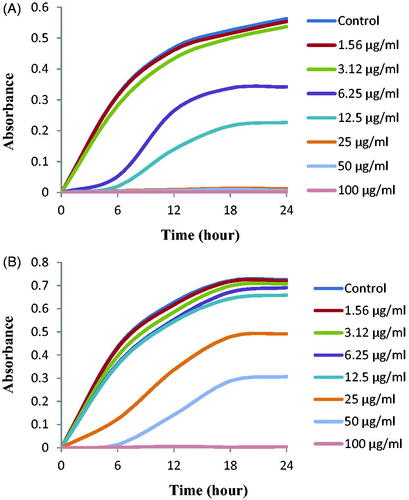
Figure 10. MBC of biosynthesized AgNPs against E. coli (A) and S. aureus (B).
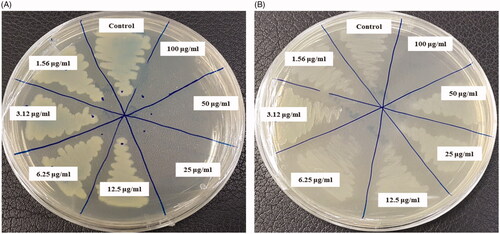
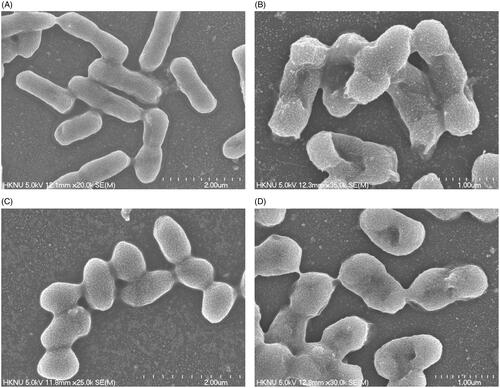
Figure 11. FE-SEM images of normal E. coli cells (A), 1 × MBC AgNPs treated E. coli cells (B), normal S. aureus cells (C), 1 × MBC AgNPs treated S. aureus cells (D).