Figures & data
Figure 3. Water contact angle of pure PLGA nanofibres (A) and PLGA/GO nanofibres (B). (C) Average water contact angle of PLGA and PLGA/GO nanofibers. (*, p < .05, n = 4).
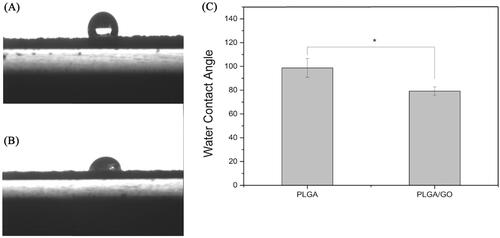
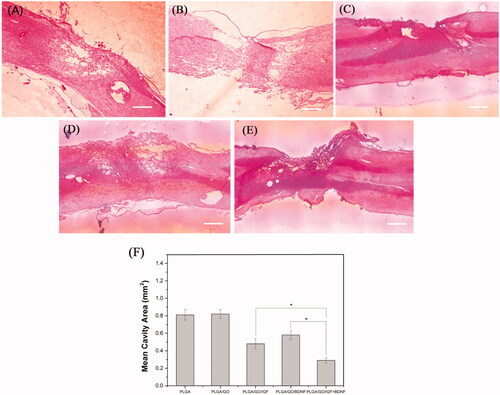
Figure 10. Longitudinal HE staining of spinal cord tissue after 4 weeks post-operation. (A) PLGA group. (B) PLGA/GO group. (C) PLGA/GO/IGF group. (D) PLGA/GO/BDNF group. (E) PLGA/GO/IGF/BDNF group. The Scale bar was 500 mm. (F) Quantification of the cavity areas of spinal cord tissue.