Figures & data
Figure 1. Characteristic of ZnO/CNT@Fe3O4 nanofluid product. (A) FTIR spectrum of ZnO/CNT@Fe3O4 nanocomposite. (B) ZnO/CNT@Fe3O4 exhibited high absorption peaks at 190 and 204 nm wavelengths and a few low ladder shaped peaks in UV visible. (C) XRD analysis confirmed the structural characteristics of ZnO/CNT@Fe3O4. (D) Scanning electron microscopy (SEM) and transmission electron microscopy (TEM) of the nanoparticle. SEM illustrated the morphology of the ZnO/CNT@Fe3O4 nanocomposites in nano-product. Spherical fine Q-dot ZnO NPs and Fe3O4 NPs are combined together with CNT NPs. The results of TEM also validated the small size of this nanocomposite at 75 nm.
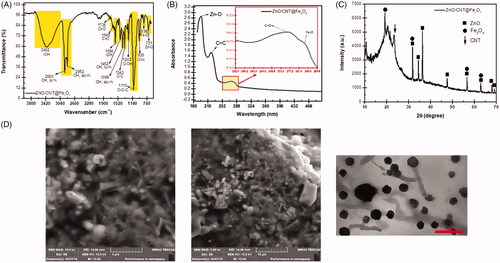
Figure 2. Treatment of K562 cells with ZnO/CNT@Fe3O4 significantly inhibited cell viability and metabolic activity of cells in both time- and concentration-dependent manner. Values are given as mean ± standard deviation of three independent experiments. *p ≤ .05 represents significant changes from untreated control.
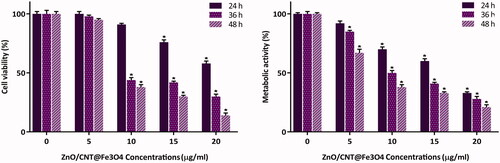
Figure 3. ZnO/CNT@Fe3O4 suppressed the proliferative capacity of K562 cells through alteration of cell distribution in cell cycle. (A) Treatment of cells with increasing concentrations of the nanocomposite not only significantly reduced the number of K562 cells but also halted the transition of cells from G1 phase of cell cycle. (B) The results of BrdU assay showed that ZnO/CNT@Fe3O4 could hamper the ability of CML cells to replicate DNA in a concentrations-dependent manner. (C) Results of RQ-PCR analysis demonstrated that treatment of K562 cells with ZnO/CNT@Fe3O4 robustly altered the expression levels of cyclin-dependent kinase inhibitors and c-Myc. Values are given as mean ± standard deviation of three independent experiments. * p ≤.05 represents significant changes from untreated control.
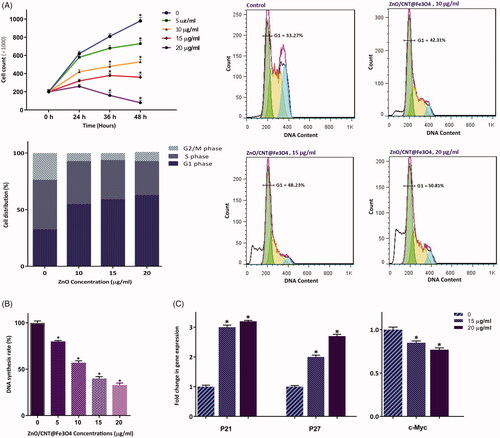
Figure 4. Evaluation of ZnO/CNT@Fe3O4 effect on induction of apoptosis in K562 cells. ZnO/CNT@Fe3O4 increased cell population in sub-G1 in CML-derived cells. Values are given as mean ± standard deviation of three independent experiments. *p ≤ .05 represents significant changes from untreated control. The percentage of apoptotic cells in nanocomposite-treated group was increased in response to drug treatment in a concentration-dependent manner.
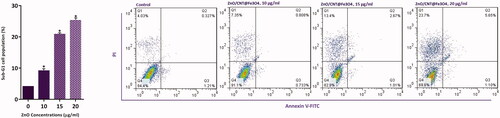
Figure 5. Evaluating the effect of autophagy inhibition on ZnO/CNT@Fe3O4-induced anti-leukemic effect. (A) Treatment of K562 cells with autophagy inhibitor chloroquine (CQ) at the concentration of 40 μM led to a conspicuous reduction in the red-to-green fluorescence intensity ratio. (B) Combinational treatment of CQ (40 μM) with ZnO/CNT@Fe3O4 resulted in superior cytotoxicity as compared with either agent alone. Values are given as mean ± standard deviation of three independent experiments. *p ≤ .05 represents significant changes from untreated control.
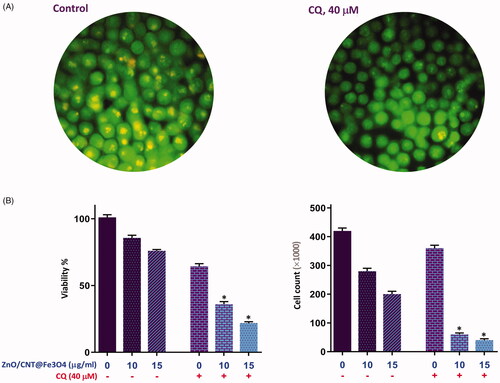
Figure 6. The effect of ZnO/CNT@Fe3O4 on the transcriptional activity of apoptosis-related genes. (A) After treatment of K562 cells with designated concentrations of the drug and harvesting the RNA, the expression of the indicated genes was measured using Rq-PCR after normalising the cycle threshold (Ct) of each triplicate against their corresponding HPRT. (B) The results of RQ-PCR analysis revealed that single agent of ZnO/CNT@Fe3O4 was unable to alter the expression of the anti-apoptotic members of IAP family, survivin and XIAP, which their expression regulate via NF-κB signalling pathway. Moreover, treatment of K562 cells with a proteasome inhibitor, Bortezomib (BTZ), increased the sensitivity of cells to ZnO/CNT@Fe3O4; suggestive of a contributory role of NF-κB signalling pathway in the cell response to nanocomposite. Values are given as mean ± standard deviation of three independent experiments. *p ≤ .05 represents significant changes from untreated control.
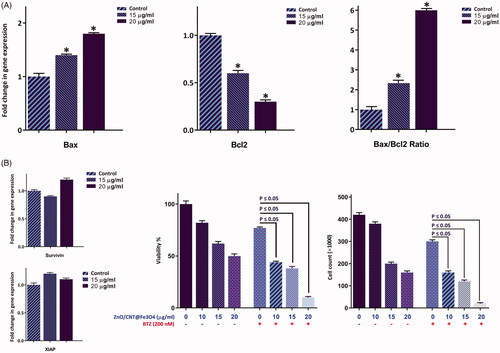
Figure 7. Treatment of ZnO/CNT@Fe3O4 not only increased the amount of intracellular level of ROS in K562 cells, but also elevated the expression level of SIRT1 and Foxo3a in a concentration-dependent manner. Values are given as mean ± standard deviation of three independent experiments. *p ≤ .05 represents significant changes from untreated control.
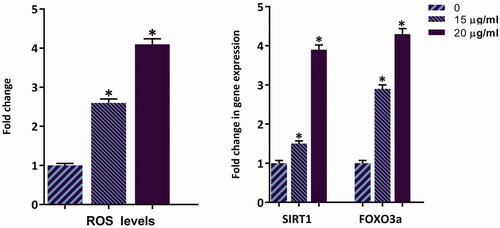
Figure 8. Synergistic effect of ZnO/CNT@Fe3O4 with imatinib. After simultaneous treatment of K562 cells with ZnO/CNT@Fe3O4 and imatinib viability and metabolic activity were evaluated using trypan blue exclusion and MTT assays. Combination index (CI) was calculated according to the classic isobologram equation; (Dx)1 and (Dx)2 indicate the individual concentrations of ZnO/CNT@Fe3O4 and imatinib required to inhibit a given level of viability index, and (D)1 and (D)2 are the concentrations of ZnO/CNT@Fe3O4 and imatinib necessary to produce the same effect in combination, respectively. Points above and below the isoeffect line reflect antagonism and synergy, respectively.
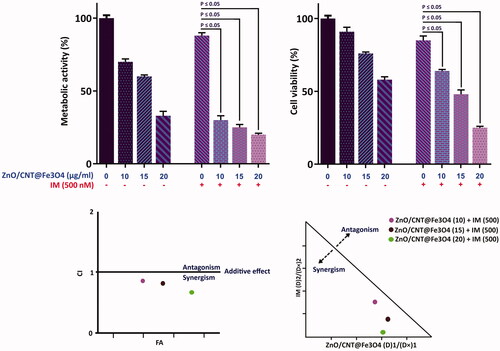
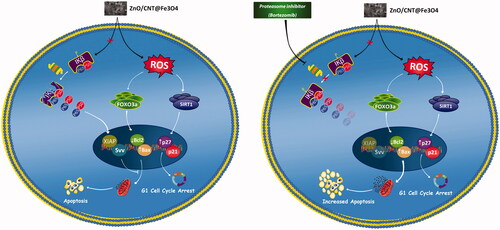
Figure 9. Schematic representation proposed for the plausible mechanisms of action of ZnO/CNT@Fe3O4 in K562 cells. Treatment of CML-derived cells with metal nanoparticle ZnO/CNT@Fe3O4 augmented the intracellular level of ROS, which in turn induced apoptotic cell death via upregulation of SIRT1 and FOXO3a. However, our results suggest that the effectiveness of this nanoparticle could be diminished, at least partially, through over-activated nuclear factor-κB in K562 cells. More interestingly, we found that Suppression of NF-κB signalling pathway in K562 cells using a well-known proteasome inhibitor, Bortezomib, enhanced the cytotoxic effect of ZnO/CNT@Fe3O4 probably through suppression of the expression level of anti-apoptotic members of IAP family.