3,989
Views
7
CrossRef citations to date
0
Altmetric
Review

The negative effects of obesity on heart, especially the electrophysiology of the heart

, , &
Pages 1055-1062 | Received 05 Nov 2019, Accepted 22 Feb 2020, Published online: 22 Jul 2020

Figures & data

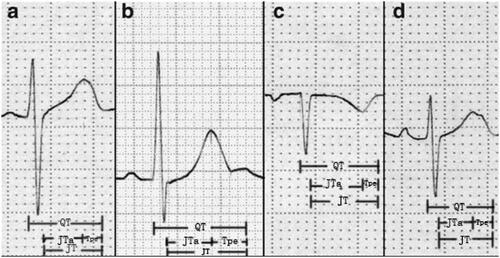
Table 1. Different indicators in ventricular electrophysiology.

Figure 1. Measurement of RV indicators. The measurement of QT starts from the Q wave to the end of the T wave, including the QRS wave, the ST segment, and the T wave. JT is defined as the QT to remove the QRS wave portion. Tpe starts from the T peak and ends at the T wave. JTa is the interval between the J point and the apex of the T wave b. When there is a U wave, the T wave end is defined as the lowest point of the curve between the T wave and the U wave.c. In the p-wave inverted electrocardiogram, the representation of QT interval, Tpe, JT and JTa.d. In the bi-peak ECG of T wave, the representation of QT interval, Tpe, JT and JTa.

Figure 1. Measurement of RV indicators. The measurement of QT starts from the Q wave to the end of the T wave, including the QRS wave, the ST segment, and the T wave. JT is defined as the QT to remove the QRS wave portion. Tpe starts from the T peak and ends at the T wave. JTa is the interval between the J point and the apex of the T wave b. When there is a U wave, the T wave end is defined as the lowest point of the curve between the T wave and the U wave.c. In the p-wave inverted electrocardiogram, the representation of QT interval, Tpe, JT and JTa.d. In the bi-peak ECG of T wave, the representation of QT interval, Tpe, JT and JTa.

Figure 2. Metabolic abnormalities caused by obesity and CVD.

Figure 2. Metabolic abnormalities caused by obesity and CVD.

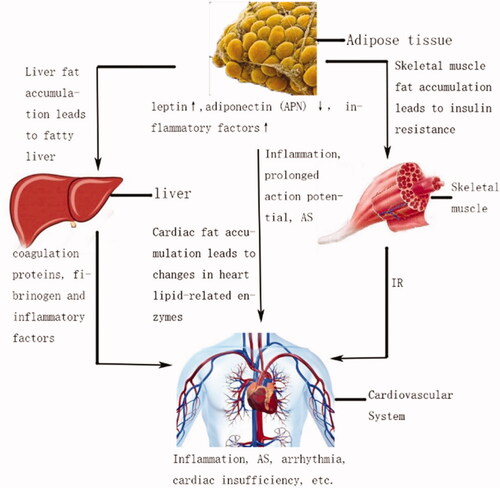
Table 2. The association of obesity and cardiac indicators.