Figures & data
Table 1. Relationship between miR-155 expression and clinicopathological characteristics.
Figure 1. Relative miR-155 expression levels. The expression of miR-155 in ESCC tissues was significantly higher than that in matched adjacent samples (p < .001) and healthy control specimens (p < .001).
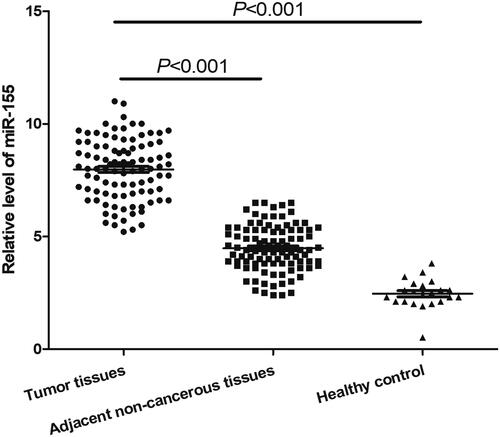
Table 2. Multivariate analysis of prognostic factors in ESCC.
Figure 2. The comparison of miR-155 expression in malignant tissues between ESCC patients with different ages (A), tumour sizes (B), tumour invasions (C) and TNM stages (D).
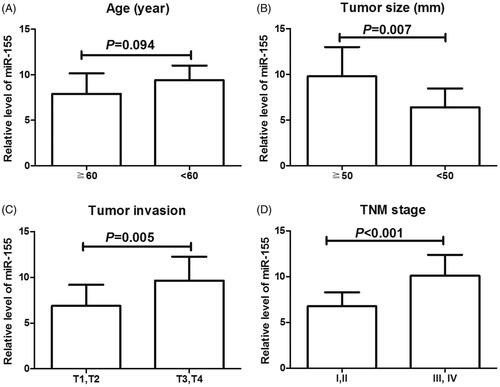
Figure 3. Receiver operating characteristics (ROC) curve analysis for the diagnostic value of miR-155 in ESCC. The AUC (the areas under the ROC curve) was 0.870 (95%CI = 0.797–0.943, p < .001), with a sensitivity of 83.5% and a specificity of 77.5%, respectively.
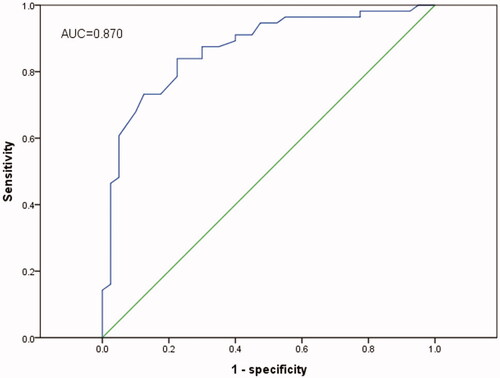
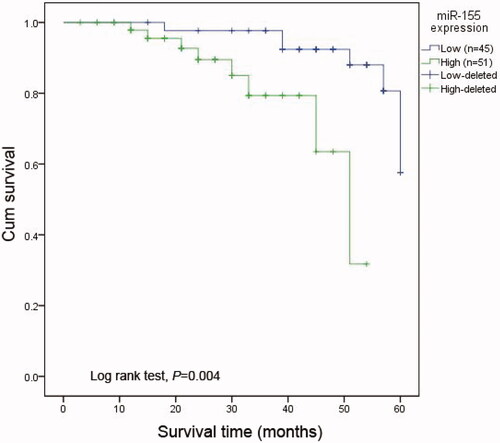
Figure 4. Kaplan-Meier analysis for the overall survival of patients with ESCC according to the expression of miR-155. Patients with high miR-155 expression had shorter overall survival than those with low expression. Log rank test proved that the difference was significant (p < .01).