Figures & data
Figure 1. Schematic illustration of green synthesis in the current report.
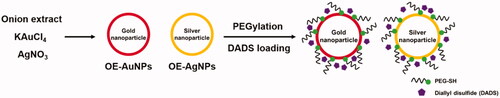
Figure 2. SPR observation. (A) OE-AuNPs (black line) and OE-AgNPs (red line). The inset shows a digital photograph of each colloidal solution: OE-AuNPs (left) and OE-AgNPs (right). (B) DADS-P10-AuNPs (red line), DADS-P20-AuNPs (orange line), DADS-P10-AgNPs (yellow line) and DADS-P20-AgNPs (green line). The inset shows a digital photograph of each colloidal solution: DADS-P10-AuNPs (left) and DADS-P10-AgNPs (right).
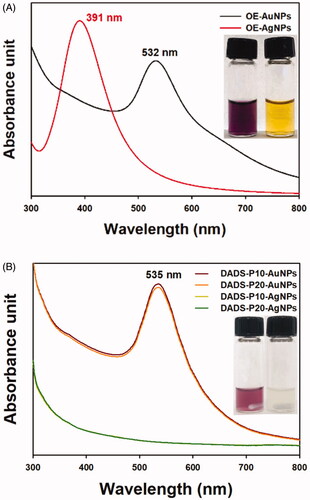
Figure 3. Colloidal stability in different solutions. (A) OE-AuNPs and (B) OE-AgNPs. Each inset shows a digital photograph of the nanoparticles in different solutions.
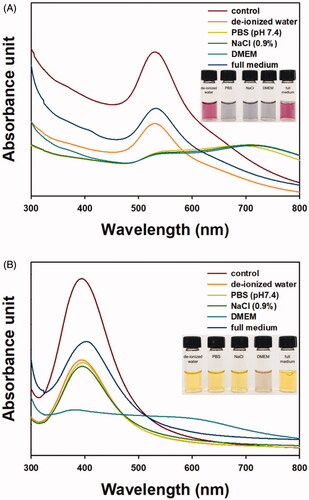
Figure 4. X-ray diffraction pattern. (A) OE-AuNPs and (B) OE-AgNPs. A black asterisk represents a byproduct of the reaction.
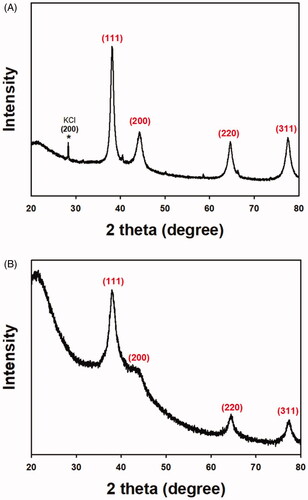
Table 1. Hydrodynamic size and zeta potential of the nanoparticles.
Figure 5. FE-TEM and AFM images of OE-AuNPs. (A) FE-TEM images (scale bar: 200 nm), (B) FE-TEM images (scale bar: 100 nm), (C) AFM height sensor image (2.5 μm × 2.5 μm) and (D) AFM phase image (2.5 μm × 2.5 μm).
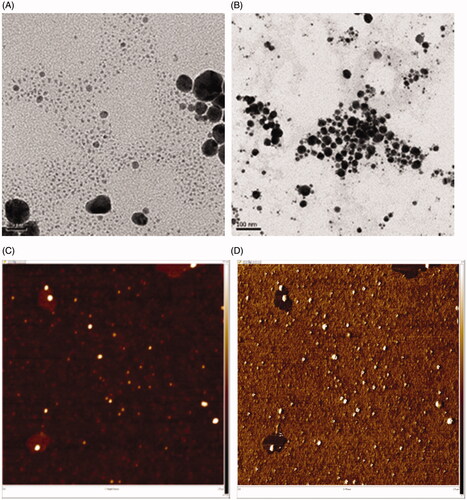
Figure 6. FE-TEM and AFM images of OE-AgNPs. (A) FE-TEM images (scale bar: 50 nm), (B) FE-TEM images (scale bar: 20 nm), (C) AFM height sensor image (2.5 μm × 2.5 μm) and (D) AFM phase image (2.5 μm × 2.5 μm).
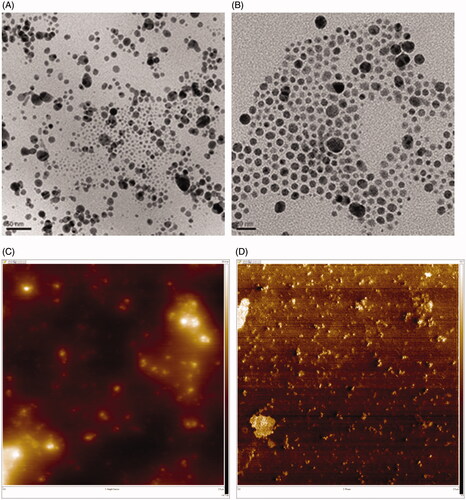
Figure 7. Size histograms. (A) OE-AuNPs and (B) OE-AgNPs.
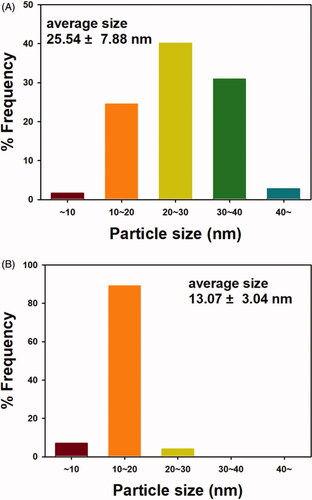
Figure 8. UV-visible spectra of the 4-NP reduction reaction by sodium borohydride in the presence of the OE-AuNP catalyst. (A) 120-μL addition of the OE-AuNP catalyst, (B) 63-μL addition of the OE-AuNP catalyst, and (C) a plot of ln(Ct/C0) as a function of time (sec) from the data of (A) and (B).
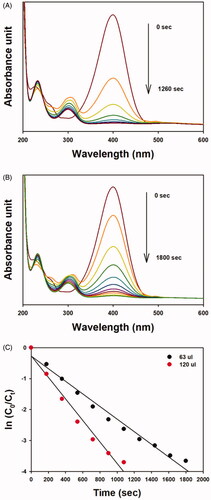
Figure 9. UV-visible spectra of the MO degradation reaction by sodium borohydride in the presence of the OE-AgNP catalyst; (A) 55-μL addition of the OE-AgNP catalyst, (B) 25-μL addition of the OE-AgNP catalyst, and (F) a plot of ln(Ct/C0) as a function of time (sec) from the data of (A) and (B).
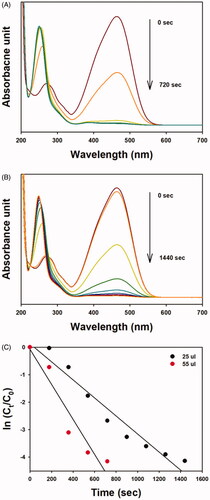
Table 2. Assessment of catalytic activity of OE-AuNPs and OE-AgNPs.
Figure 10. FE-TEM images. (A) DADS-P10-AuNPs (scale bar: 50 nm), (B) DADS-P20-AuNPs (scale bar: 50 nm), (C) DADS-P10-AgNPs (scale bar: 50 nm), (D) DADS-P10-AgNPs (scale bar: 20 nm), (E) DADS-P20-AgNPs (scale bar: 50 nm) and (F) DADS-P20-AgNPs (scale bar: 20 nm).
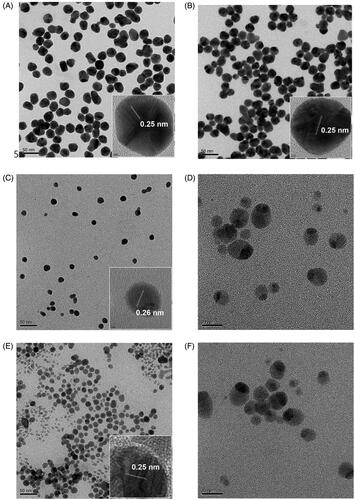
Figure 11. Size histograms. (A) DADS-P10-AuNPs, (B) DADS-P20-AuNPs, (C) DADS-P10-AgNPs and (D) DADS-P20-AuNPs.
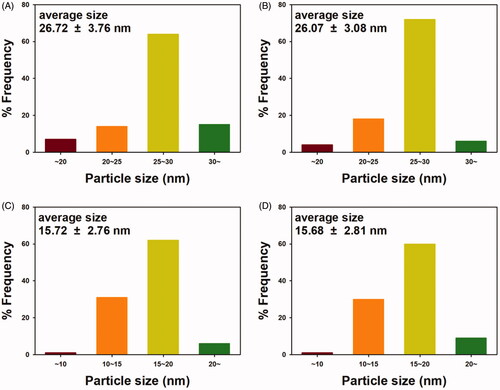
Figure 12. Cytotoxicity assessment of OE-AuNPs and OE-AgNPs against HT-29 and PANC-1 cell lines. (A) OE-AuNPs and (B) OE-AgNPs.
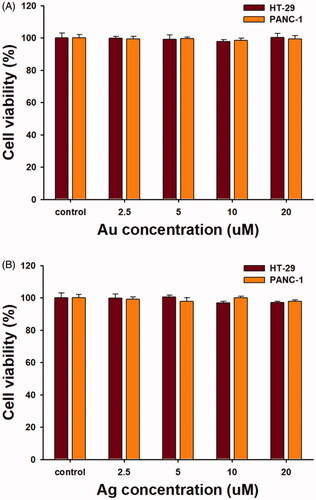
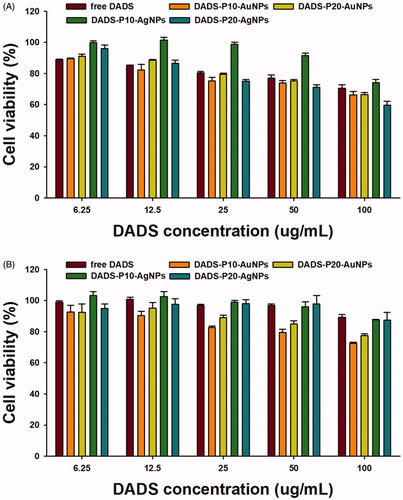
Figure 13. Cytotoxicity assessment of PEGylated and DADS-loaded AuNPs and AgNPs against HT-29 and PANC-1 cell lines: DADS-P10-AuNPs, DADS-P20-AuNPs, DADS-P10-AgNPs and DADS-P20-AgNPs. (A) PANC-1 and (B) HT-29 cell lines.