Figures & data
Figure 1. (A) UV-Visible spectrum absorption pattern, (B) TEM and (C) TEM analysis of ZnO-NPs synthesised from V. amygdalina. UV-Vis absorption spectra of ZnO-NPs. The peak values for UV-VIS, plotted between ZnO-NPs/absorbance ratios. The highest absorbance peak is about 350.00. All solutions were in water. V. amygdalina extract ZnO NPs were found as nano shaped ( The organisation, segment and form of amalgamated product were examined by the SEM study.
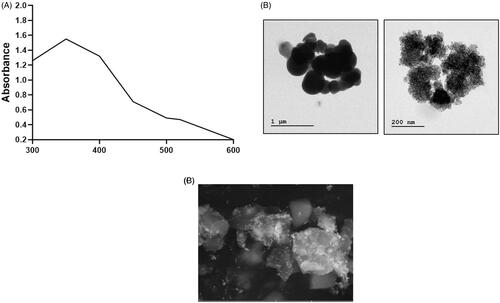
Figure 2. FTIR spectra of ZnO nanoparticles of V. amygdalina. V. amygdalina extract were answerable for the configuration of a variety of nanoparticles. The FTIR range of V. amygdalina illustrated several assimilation peaks ranged from 3500 cm−1 to 500 cm−1. shows the representative FT-IR spectra obtained from V. amygdalina.
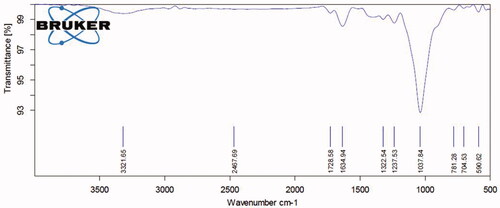
Figure 3. X-ray diffraction analysis of ZnO-NPs synthesised from V. amygdalina. The XRD pattern showed dissimilar concentration peaks in the entire band of 2θ values between range from 25° to 75° for the V. amygdalina extract. The V. amygdalina synthesised ZnO NPs were indexed as 100, 002, 101, 102, 110, 103, 112, and 201. The zinc was indexed and excited at 101 and 100.
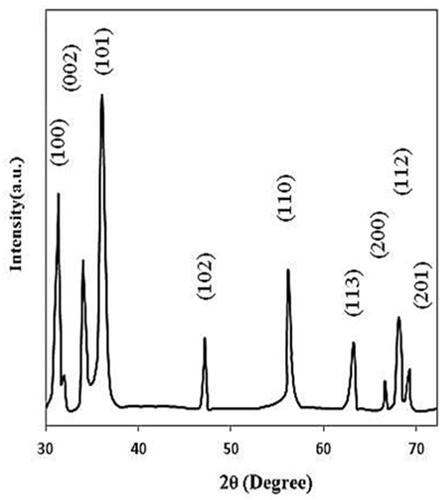
Figure 4. Antinociceptive upshot of ZNO-NP in the nociception induced by acetic acid in mice. All values are illustrated as mean ± SD of six animals. The statistical significance level was calculated by one-way ANOVA followed by the Dunnet’s post hoc test; note: #p < .05 when compared with control group and *p < .05 when compared with ZnONPs administered groups.
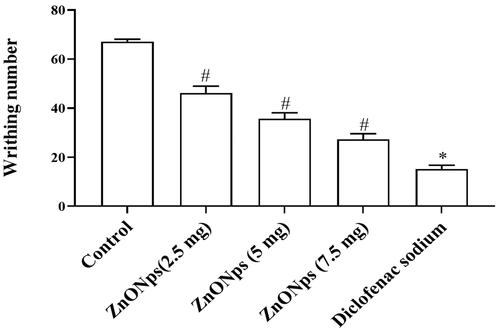
Figure 5. Antinociceptive consequence of ZNO-NP in the nociception encouraged by glutamate in mice. All values are illustrated as mean ± SD of six animals. The statistical significance level was calculated by one-way ANOVA followed by the Dunnet’s post hoc test; note: #p < .05 when compared with control group and *p < .05 when compared with ZnONPs administered groups.
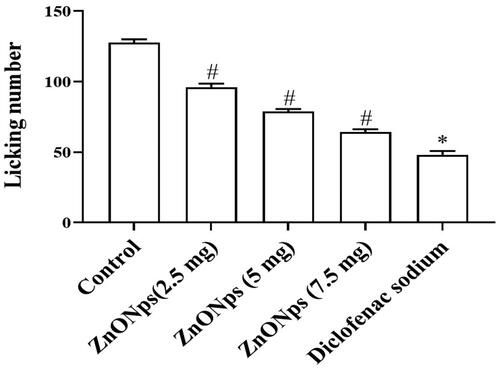
Figure 6. Effect of ZNO-NP on capsaicin-induced licking in mice. All values are illustrated as mean ± SD of six animals. The statistical significance level was calculated by one-way ANOVA followed by the Dunnet’s post hoc test; note: #p < .05 when compared with control group and *p < .05 when compared with ZnONPs administered groups.
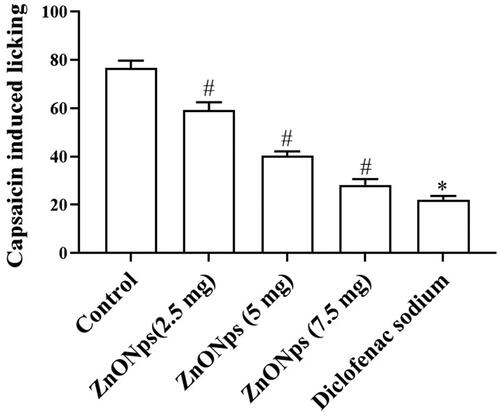
Figure 7. Result of ZNO-NP on duration of formalin-induced paw-licking (seconds) in the first 5 min (first phase, A) and from 15 to 30 min (second phase, B) of nociception in mice. All values are illustrated as mean ± SD of six animals. The statistical significance level was calculated by one-way ANOVA followed by the Dunnet’s post hoc test; note: #p < .05 when compared with control group and *p < .05 when compared with ZnONPs administered groups.
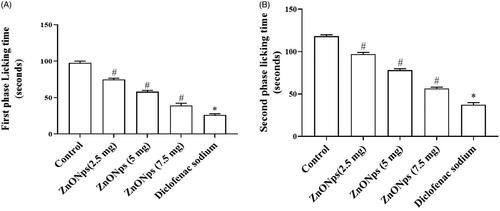
Figure 8. Effect of ZNO-NP on total leukocytic mononuclear and polymorphonuclear cell recruitment into the peritoneal cavity of mice. All values are illustrated as mean ± SD of six animals. The statistical significance level was calculated by one-way ANOVA followed by the Dunnet’s post hoc test; note: #p < .05 when compared with control group and *p < .05 when compared with ZnONPs administered groups.
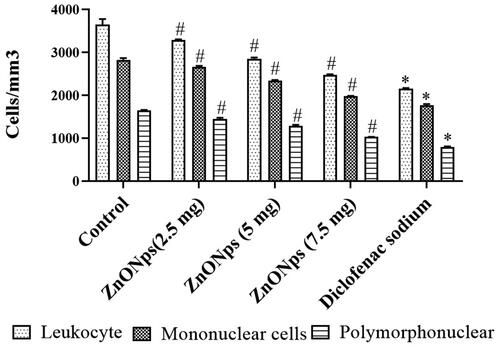
Figure 9. The consequence of ZNO-NP on TNF-α, IL-1β, and IL-6 fabrication in the air pouch test. All values are illustrated as mean ± SD of six animals. The statistical significance level was calculated by one-way ANOVA followed by the Dunnet’s post hoc test; note: #p < .05 when compared with control group and *p < .05 when compared with ZnONPs administered groups. (A) TNF (pg/ml) (B) IL-1β (pg/ml) (C) IL-6 (pg/ml).
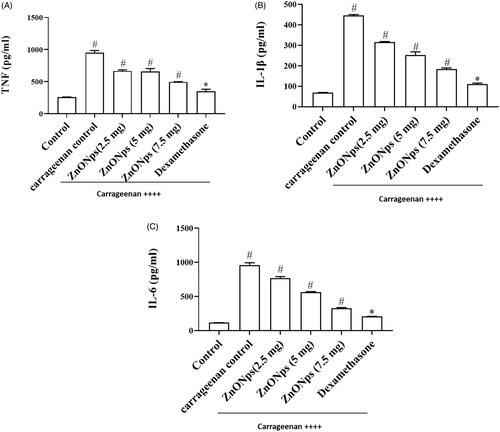
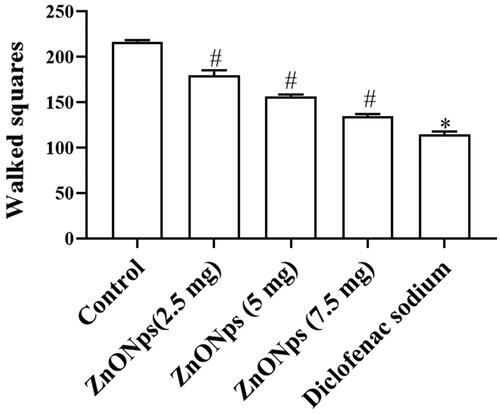
Figure 10. The effects of ZNO-NP in the open field test. All values are illustrated as mean ± SD of six animals. The statistical significance level was calculated by one-way ANOVA followed by the Dunnet’s post hoc test; note: #p < .05 when compared with control group and *p < .05 when compared with ZnONPs administered groups.