
Figures & data
Figure 1. The scheme used for the preparation of GA/FG-C18 NMs (A), the particle size distribution (B) and the TEM image (C), bar = 200 nm.
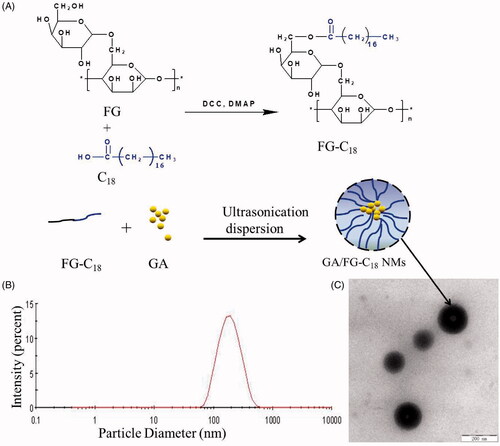
Table 1. Physicochemical properties of GA/FG-C18 nanomicelles.
Figure 2. DSC thermograms (A) and XRD patterns (B) of GA (a); FG-C18 (b); physical mixture of the two (c) and GA/FG-C18 NMs (d).
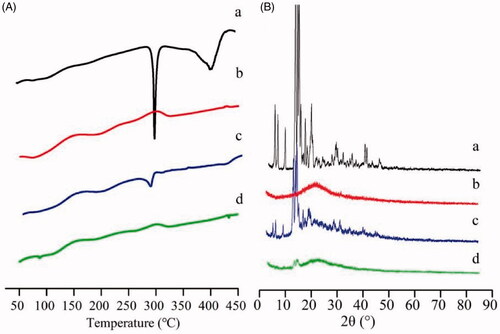
Figure 3. In vitro drug release profiles of GA/FG-C18 NMs and free GA in PBS, pH 7.4.
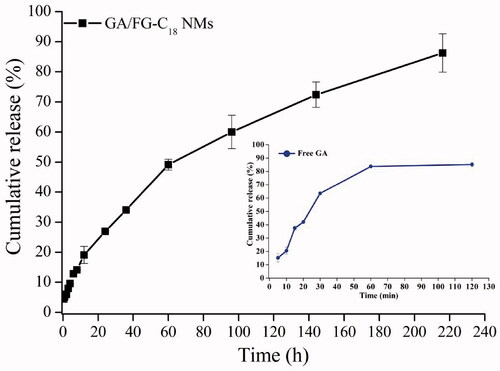
Figure 4. Cell viability of HepG2 and MCF-7 cells treated with free GA and GA/FG-C18 NMs at 24 h (A), 48 h (B) and 72 h (C). Note: +Gal: with 0.2 M galactose; -Gal: without galactose. Each point is represented as the mean ± standard deviation (n = 6). **p < .01, compared with HepG2 cells pre-treated with galactose and MCF-7 cells without galactose.
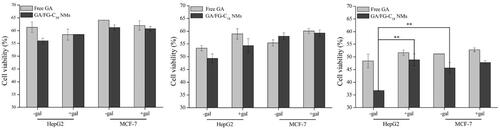
Figure 5. CLSM images of liver slices after i.v. administration of DiR/FG-C18 NMs and free DiR for 30 min at 4 h and 8 h. Note: Blue and red indicate DAPI and DiR fluorescence, respectively.
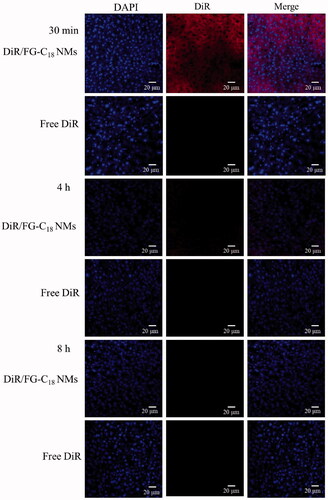
Figure 6. Plasma concentration-time curve after the intravenous administration of GA/FG-C18 NMs and free GA.
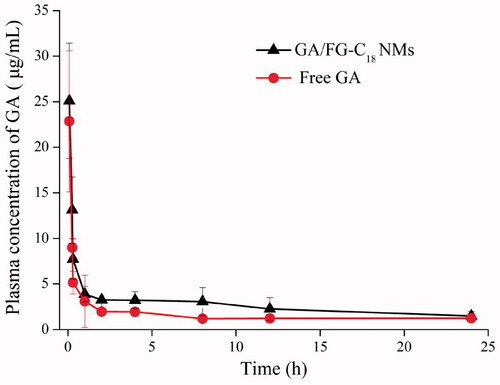
Table 2. Pharmacokinetic parameters after the intravenous administration of GA/FG-C18 NMs and free GA (n = 6).
Figure 7. Concentration-time profile of GA/FG-C18 NMs and free GA in heart, liver, spleen, lung, kidney and brain at predetermined times after tail vein i.v. injection.
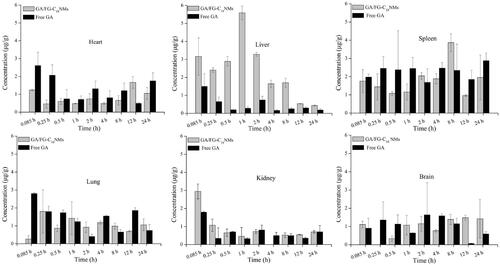
Table 3. The AUC0–24 h and Te of each tissue after intravenous administration of GA/FG-C18 NMs and free GA.