Figures & data
Figure 1. Characterization of targeting molecular. (A) MALDI-TOF-MS spectrum of TPGS1000 and (B) MALDI-TOF-MS spectrum of TPGS1000-GLU.
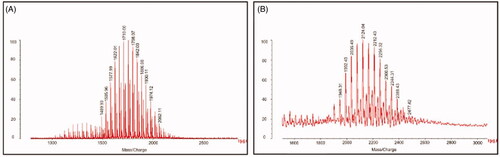
Figure 2. Characterization of dual targeting daunorubicin plus rofecoxib liposomes. (A) TEM image of dual targeting daunorubicin plus rofecoxib liposomes, (B) two-dimension AFM image of dual targeting daunorubicin plus rofecoxib liposomes, (C) three-dimension AFM image of dual targeting daunorubicin plus rofecoxib liposomes, (C) size distribution of dual targeting daunorubicin plus rofecoxib liposomes and (D) zeta value of dual targeting daunorubicin plus rofecoxib liposomes.
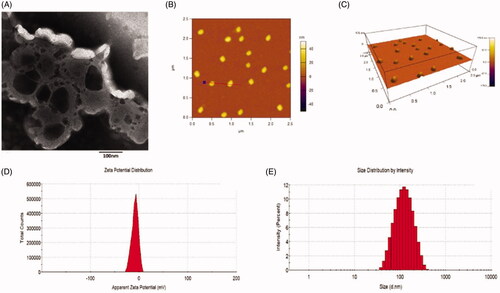
Figure 3. In vitro release rates of drugs from varying liposomes in the simulated body fluids. (A) Release rate of daunorubicin from varying formulations in PBS solution containing 10% FBS, (B) release rate of daunorubicin from varying formulations in PBS, (C) release rate of rofecoxib from varying formulations in PBS solution containing 10% FBS, (D) release rate of rofecoxib from varying formulations in PBS. Data are presented as mean ± standard deviation (SD) (n = 3).
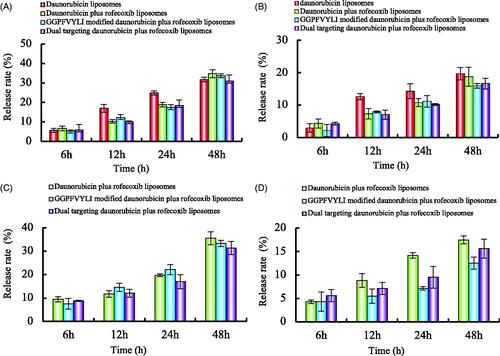
Table 1. Characterization of the liposomes.
Figure 4. Cellular uptake after incubation with varying formulations. (A) Cellular uptake of U87MG cells and (B) cellular uptake of BMVECs cells. (a) Blank control; (b) coumarin liposomes; (c) GGPFVYLI modified coumarin plus rofecoxib liposomes; (d) dual targeting coumarin plus rofecoxib liposomes; (e) free coumarin.
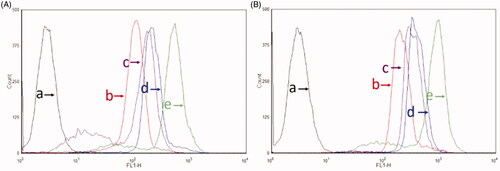
Figure 5. Inhibitory effects to U87MG cells after treatment with the varying formulations. (a) vs. blank control; (b) vs. daunorubicin liposomes; (c) vs. daunorubicin plus rofecoxib liposomes; (d) vs. GGPFVYLI modified daunorubicin plus rofecoxib liposomes. Data are presented as mean ± SD (n = 6).
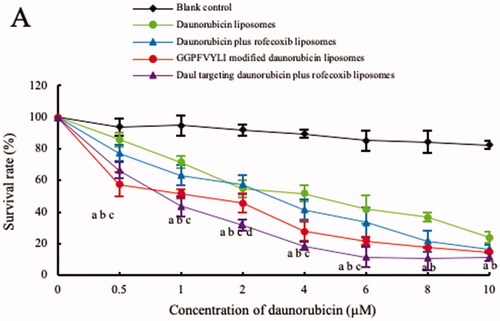
Figure 6. Transport ability of dual targeting daunorubicin plus rofecoxib liposomes across the BBB model. p<.05. (a) vs. 1; (b) vs. 2; (c) vs. 3. Data are presented as the mean ± SD (n = 4).
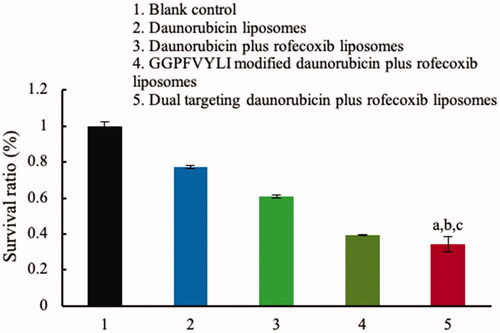
Figure 7. Destruction of VM channels in vitro formed by brain glioma U87MG cells in the three dimension (3D) matrigel after treatment with dual targeting daunorubicin plus rofecoxib liposomes. (1) Blank control; (2) daunorubicin liposomes; (3) rofecoxib liposomes; (4) daunorubicin plus rofecoxib liposomes; (5) GGPFVYLI modified daunorubicin plus rofecoxib liposomes; (6) dual targeting daunorubicin plus rofecoxib liposomes. p<.05. (a) vs. 1; (b) vs. 2; (c) vs. 3; (d) vs. 4.
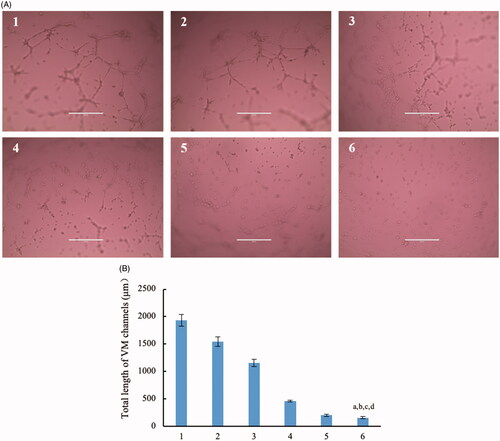
Figure 8. Inhibition on the VM indicators in brain glioma cells after treatment with dual targeting daunorubicin plus rofecoxib liposomes. (1) Blank control; (2) daunorubicin liposomes; (3) rofecoxib liposomes; (4) daunorubicin plus rofecoxib liposomes; (5) dual targeting daunorubicin plus rofecoxib liposomes. p<.05. (a) vs. 1; (b) vs. 2; (c) vs. 3; (d) vs. 4. Data are presented as the mean ± SD (n = 4).
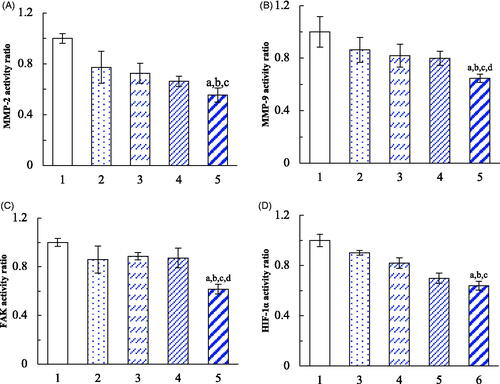
Figure 9. In vivo real-time imaging observation after intravenous administration of the varying formulations.
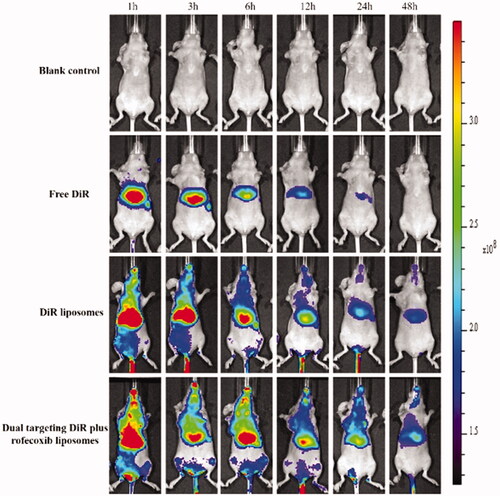
Figure 10. Anticancer efficacy evaluation by the Kaplan–Meier survival curves in the intracranial glioma-bearing nude mice.
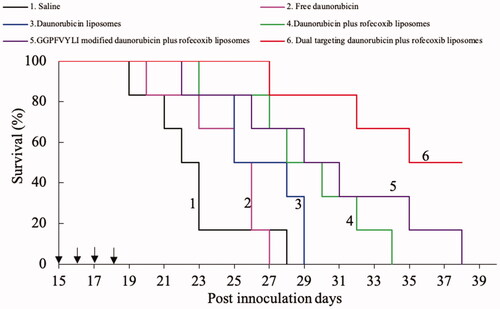
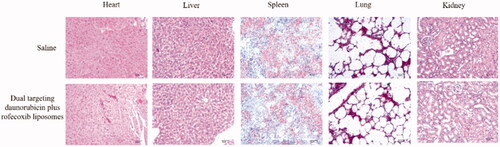
Figure 11. Preliminary toxicity comparison on the major organs of the intracranial glioma-bearing nude mice after treatment with dual targeting daunorubicin plus rofecoxib liposomes.