Figures & data
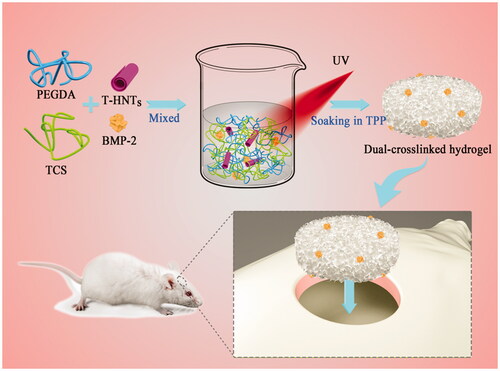
Figure 1. (A) FTIR spectra, (B) zeta potential of HNTs and T-HNTs; SEM images of (C) HNTs and (D) T-HNTs.
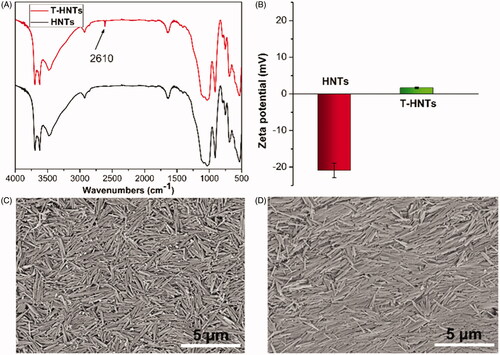
Figure 2. (A) Scheme for the fabrication of PEGDA/TCS/T-HNTs composite hydrogels, (B) schematic of hydrogel compression: (a) before compression, (b) processing of compression and (c) after compression.
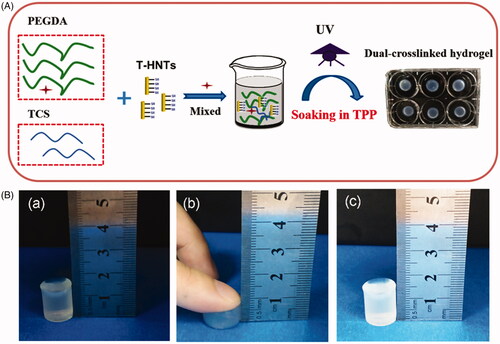
Figure 3. The typical (A) tensile and (B) compression stress-strain curves of PEGDA/TCS and PEGDA/TCS/T-HNTs with different contents of T-HNTs composite hydrogel, (C) the cyclic compressive stress-strain curves of PEGDA/TCS and PEGDA/TCS/T-HNTs-1.5 hydrogel at 70% strain, the rheological results of PEGDA/TCS and PEGDA/TCS/T-HNTs-1.5 hydrogels: (D) time sweeping of storage modulus (G′) and loss modulus (G′′) under a 50 mW/cm2 UV condition, (E) frequency-dependent (at a strain of 1%) and (F) strain-dependent (ω = 6.28 rad/s) oscillatory shear.
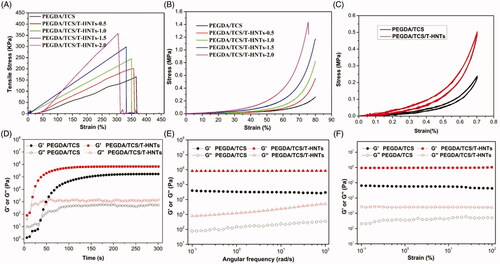
Figure 4. SEM images of (A) PEGDA/TCS and PEGDA/TCS/T-HNTs hydrogels with different contents of T-HNTs: (B) 0.5, (C) 1.0, (D) 1.5 and (E) 2.0 composite, (F) the corresponding swelling ratio of hydrogels.
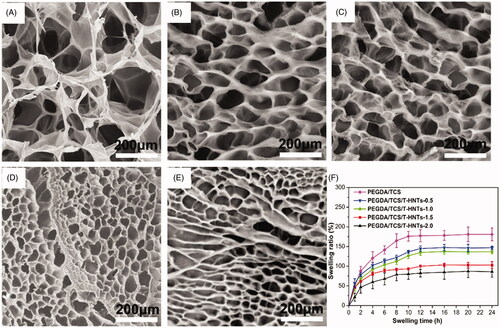
Figure 5. (A) CLSM micrographs of stained MC3T3-E1 cells showing morphology adhered on PEGDA/TCS, PEGDA/TCS/HNTs and PEGDA/TCS/T-HNTs hydrogels after 1, 3, and 7 days of culture (cytoskeleton and nucleus were stained with rhodamine-conjugated phalloidin (red) and DAPI (blue), respectively, and the scale bar is 50 µm); (B) the corresponding results of MC3T3-E1 cells. The values are represented as mean ± SD (n = 6). *p < .05, **p < .01.
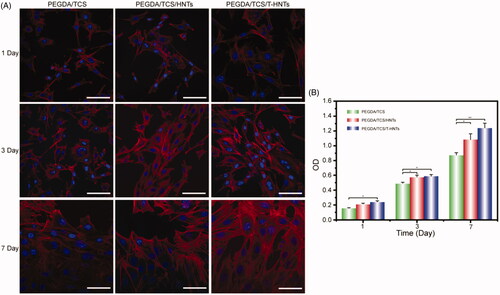
Figure 6. (A) Release curves of BMP-2 peptide from PEGDA/TCS, PEGDA/TCS/HNTs and PEGDA/TCS/T-HNTs hydrogels and (B) the corresponding drug loading capacity (black) and drug encapsulation efficiency (red) of samples.
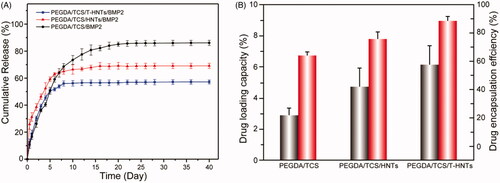
Figure 7. ARS and ALP staining (A) and semi-quantitative analysis of ALP (B) and ARS (C) at day 7. All data represent averages from three independent experiments. The values are represented as mean ± SD (n = 6). The significance of differences from control groups is *p < .05, **p < .01.
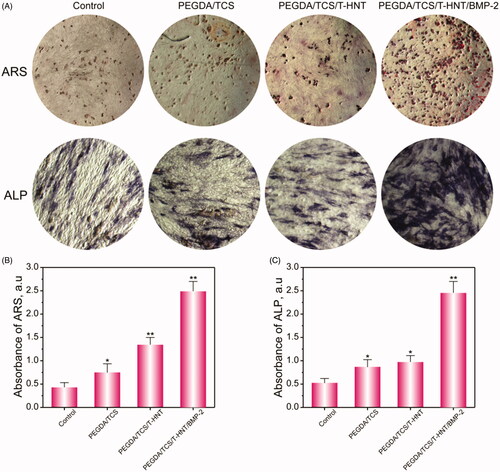
Figure 8. The HE (A) and Masson (B) staining observations of bone regeneration in cranial bone defects in rats at 1, 2, and 3 months. The scale bar is 1 mm. The black arrow represents mature bone, blue arrow represents new-born bone, yellow colour represents residual hydrogel, yellow oval represents marrow cavity, blue oval represents blood capillary, green oval represents fibrous tissue.
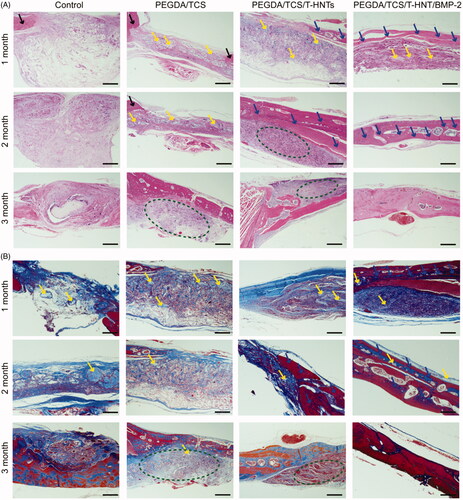
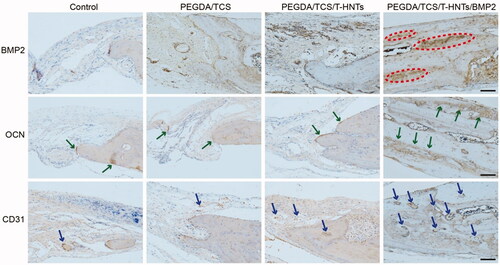
Figure 9. The immunohistochemical BMP-2, OCN and CD31 examinations of the osteogenic potential of the hydrogels were performed at 3 month for control, PEGDA/TCS, PEGDA/TCS/T-HNTs and PEGDA/TCS/T-HNTs/BMP-2 groups, respectively. The scale bar is 100 μm. The red ovals represent BMP2 proteins, green arrows represent OCN proteins, blue arrows represent CD31 proteins.