Figures & data
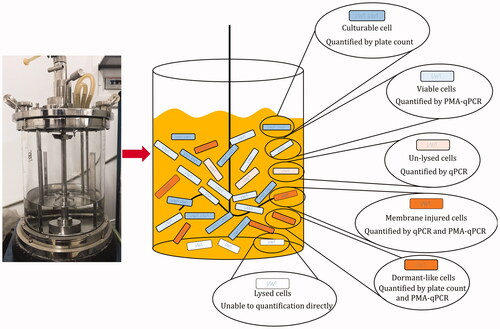
Figure 1. Calibration curve and performance of qPCR assay in quantification. (A) Calibration curve of Ct values and L. bulgaricus 16S rRNA gene copy number. (B) Relationship between L. bulgaricus 16S rRNA gene copy number and cell concentration for quantification.
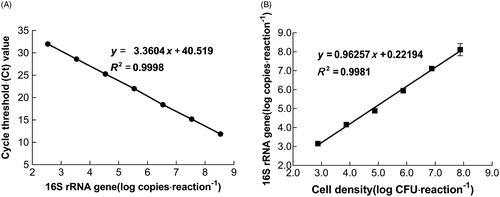
Figure 2. Relationship between Ct value and PMA concentration. Bars with different letters indicated significant differences (p<.05).
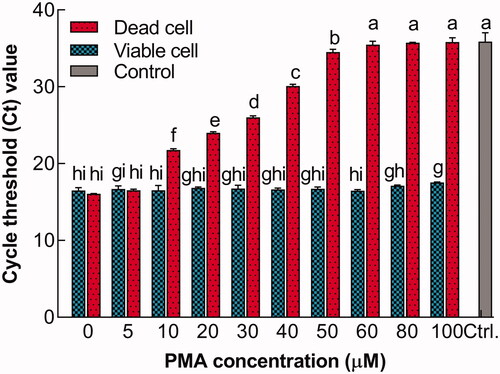
Figure 3. Technical validation of PMA-qPCR in the discrimination of viable L. bulgaricus sp1.1 cells. (A) Discrimination of viable L. bulgaricus sp1.1 cells from viable/nonviable cell mixtures by PMA-qPCR. The cells were treated with PMA (w PMA) or without PMA (w/o PMA). (B) Viable cell density quantified by PMA-qPCR and plate count. Bars or dot plots with different letters indicated significant differences (p<.05).
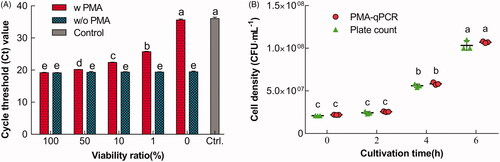
Figure 4. Time distribution of L. bulgaricus sp1.1 cell density and physiological states throughout the course of batch culture. Quantification of (A) unlysed, (C) viable, and (E) culturable L. bulgaricus sp1.1 cells by qPCR, PMA-qPCR, and plate count, respectively. (B) Cell-free DNA was enumerated by qPCR and represents detectable lysed cells. (D) Permeabilized cells were the difference between unlysed and viable cells. (F) Possible dormant-like cells were the difference between viable and culturable cells. (G) Classification of the cellular states in the present work. The insets in (A) and (F) show the optical photomicrographs of unlysed and lysed cells treated with Gram staining. The insets in (B) and (C) show the fluorescence photomicrographs, indicating the viable (green) and permeabilized (red or merged green and red) cells at the end of the exponential phase fermentation after staining with cFDA and PI. The inset in (D) shows the colonies of culturable cells in a Petri dish.
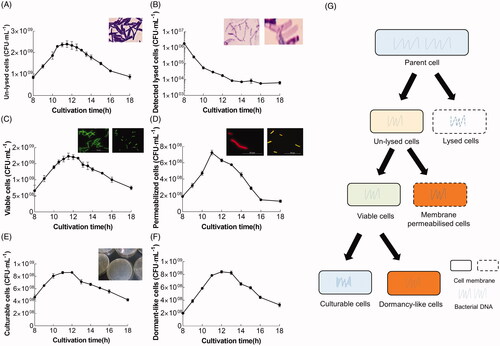
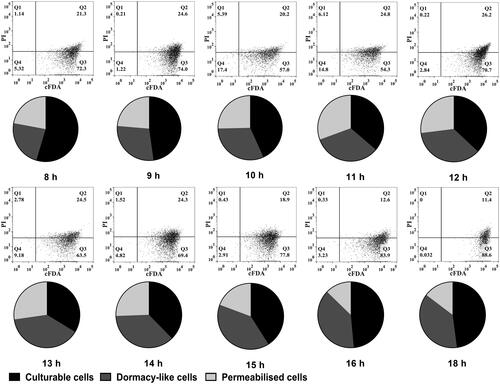
Figure 5. Composition of L. bulgaricus cellular states during batch culture identified by FCM and molecular methods. Dot plots are L. bulgaricus sp1.1 cells double-stained with cFDA and PI. Every pie sector corresponds to permeabilized and viable (including culturable and dormant-like) cells. The relative abundance is the relative proportion of each state in total unlysed cells.