
Figures & data
Figure 1. Flow diagram of the preparation process of Artemisiae Argyi Folium (AAF) extract and Artemisiae Argyi Folium Carbonisata carbon dots (AAFC-CDs).
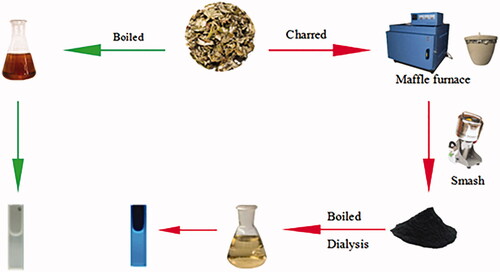
Figure 2. HPLC profiles of (a) AAF extract and (b) AAFC-CDs solution.
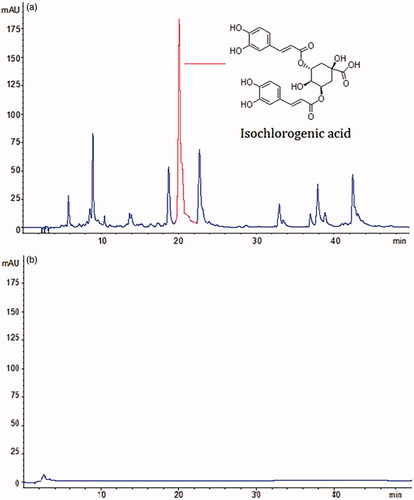
Figure 3. Characteristics of AAFC-CDs. (a) TEM image and TEM size distribution of AAFC-CDs (Upper right corner). (b) HRTEM image. (c) XRD pattern. (d) UV–Vis spectrum. (e) Fluorescence spectrum. EM: emission; EX: excitation. (f) FTIR spectrum.
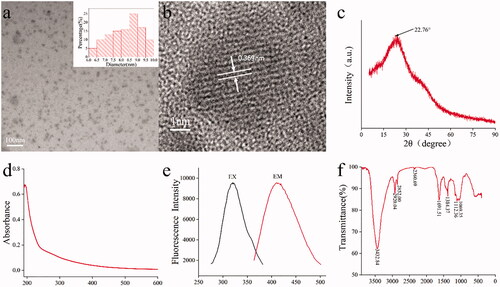
Figure 4. X-ray photoelectron spectroscopies (XPS) spectra. (a) XPS survey spectrum. (b) C 1 s XPS spectra. (c) O 1 s XPS spectra. (d) N 1 s XPS spectra.
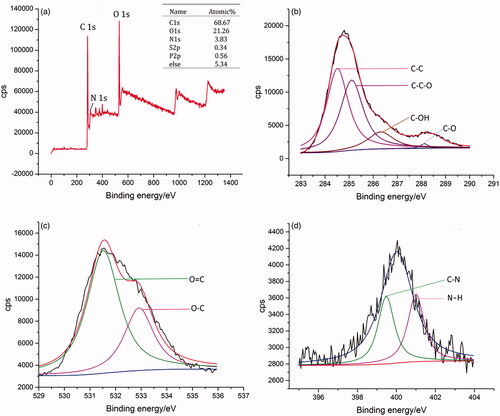
Figure 5. Morphology of mouse ear tips (a) and histology of HE-stained mice ear tips (b). (1) Model + NS group; (2) low-dose AAFC-CDs group; (3) middle-dose AAFC-CDs group; and (4) high-dose AAFC-CDs group.
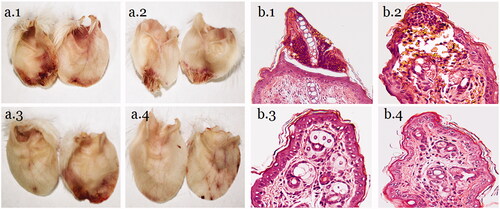
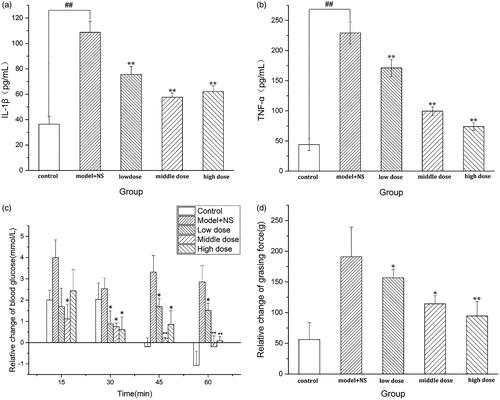
Figure 6. (a) Concentrations of IL-1β. (b) Concentrations of TNF-αin mouse sera. (c) An increase in blood glucose levels, caused by frostbite. (d) Relative changes of grip strength in mice. **p < .01 and *p < .05 compared with NS group. **p < .01 and *p < .05 compared with control group.
Data availability statement
The data that support the findings of this study are available from the corresponding author upon reasonable request.