
Figures & data
Table 1. TCGA and our BC patients’ characteristics.
Table 2. Sequences of the primers used for real-time quantitative PCR.
Figure 1. Boxplots of the mRNA (A) and protein (B) expression levels of 20 IAGs in BC and normal tissues.
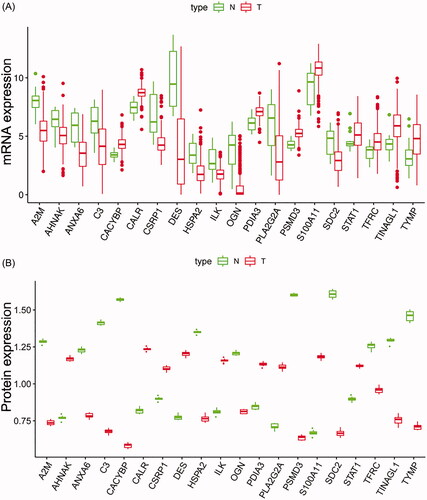
Figure 2. The relationship between differentially expressed IAGs and survival of BC patients. Univariate Cox regression analysis shows that a total of seven differentially expressed IAGs are closely associated with the OS of BC patients (p < .05).
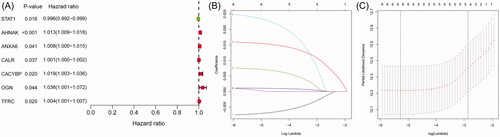
Figure 3. Survival analyses of the IAGs based signature in BC. Kaplan–Meier’s curves revealed that high risk scores are closely associated with poor overall survival (OS), progression-free interval (PFI) and disease-specific survival (DSS) in BC patients (A–C). The ROC curves showed that AUCs for the IAGs based signature, age, gender, grade, pathologic stage, pathologic T, pathologic N, M, diagnosis subtype, radiation therapy and smoking history were 0.739, 0.569, 0.422, 0.580, 0.637, 0.597, 0.620, 0.535, 0.392, 0.454 and 0.632 (D), respectively. High risk scores indicate poor survival outcomes in NMIBC patients receiving BCG treatment (E) and BC patients receiving radiation therapy (F).
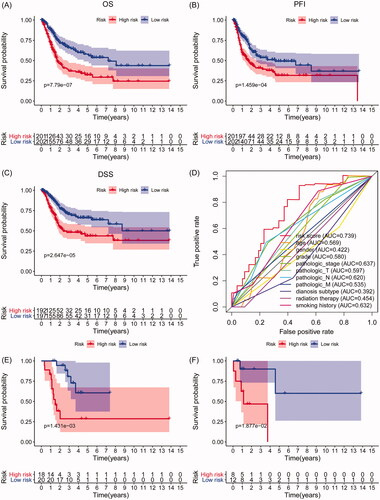
Table 3. LASSO Cox regression analysis for OS of five IAGs in BC.
Figure 4. The IAGs based signature was an independent prognostic predictor for BC. Univariate Cox regression analysis showed that age, stage, pathologic T, pathologic N and the IAGs based signature risk score were associated with the OS of BC patients (A). Multivariate Cox regression analysis indicated that the IAGs based signature was an independent prognostic factor for BC (B).
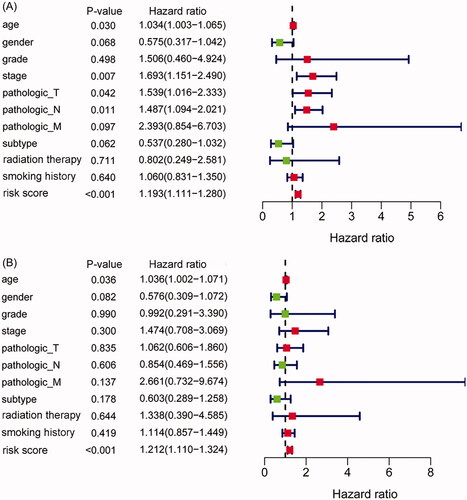
Figure 5. The relationship between the IAGs based signature and clinical characteristics. The IAGs based signature was associated with grade, stage, pathologic T, pathologic N, pathologic M, diagnosis subtype, lymphovascular invasion present and new tumour event after initial treatment (A–H), but not correlated with age, gender, BC extracapsular extension and new neoplasm event type in BC patients (I–L).
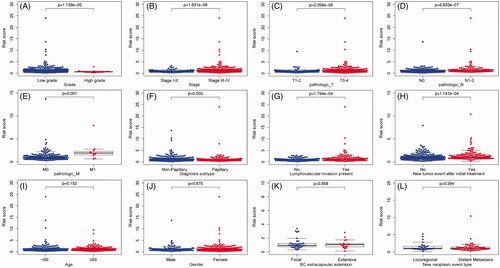
Figure 6. The expression level of five IAGs in different molecular subtypes of BC. STAT1, AHNAK, ANXA6 and CALR were highly expressed in the basal subtype (A–D). However, the expression of CACYBP was not associated with the molecular subtype of BC (E). Furthermore, BC patients with high risk scores may indicate the feature of a basal subtype (F).
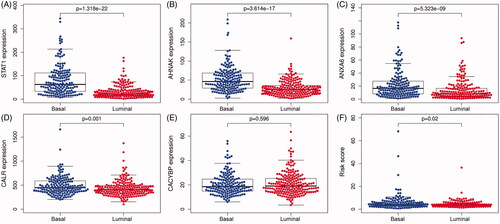
Figure 7. A prognostic nomogram with clinical features and the IAGs based signature for BC. The nomogram could superiorly predict 1, 2 and 3 years OS of BC patients.
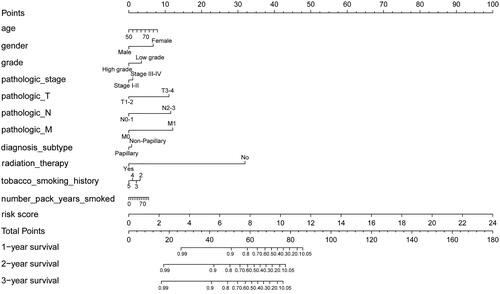
Figure 8. Association between the IAGs signature risks score and immune cell infiltration in the microenvironment of BC. The results revealed that the risk score was positively associated with the infiltration of macrophages (A). However, the risk score was not correlated with the infiltration of B cells CD4+ T cells, CD8+ T cells, dendritic cells and neutrophils (B–F).
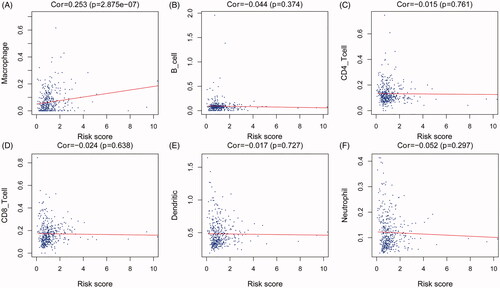
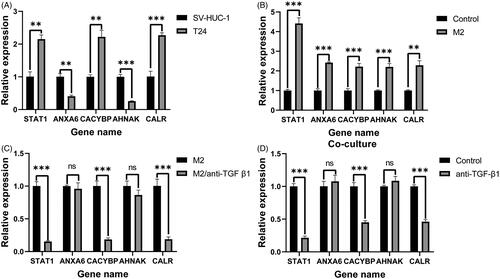
Figure 9. RT-qPCR validation of five IAGs expression in BC cells. The significant differences in the expression levels of five IAGs between T24 and SV-HUC-1 cell lines (A). Among these five IAGs, STAT1, CACYBP and CALR were upregulated, ANXA6 and AHNAK were downregulated in T24 cells. Compared with the unstimulated T24 cells, the expression of five IAGs was significantly elevated in T24 cell lines after stimulated with the supernatant of M2 TAMs (B). The expression levels STAT1, CACYBP and CALR were significantly downregulated in T24 cells when stimulated with the low TGF-β1 supernatant of M2 TAMs (C). The mRNA levels of STAT1, CACYBP and CALR were decreased by inhibiting the concentration of TGF-β1 in the coculture system. However, no significant changes in the expression levels of ANXA6 and AHNAK by inhibiting the concentration of TGF-β1 in the co-culture system (D). **p <.005; ***p <.0005.
supplementary_5.tif
Download TIFF Image (4.3 MB)Supplementary_4.docx
Download MS Word (20.6 KB)supplementary_3.tif
Download TIFF Image (574.7 KB)Supplementary_2.docx
Download MS Word (48.9 KB)supplementary_1.docx
Download MS Word (20.3 KB)Data availability statement
The data used to support the findings of this study is included within the article, and the data are available from the corresponding author upon request.