Figures & data
Figure 1. Formation of silver nanoparticles (AgNPs). (A) Colour changes. (1) Leaf extract. (2) Silver nitrate solution. (3) Silver nanoparticles at a concentration of 1 mM. (4) Silver nanoparticles at a concentration of 2.5 mM. (5) Silver nanoparticles at a concentration of 5 mM. (B) UV-spectroscopy of AgNPs.
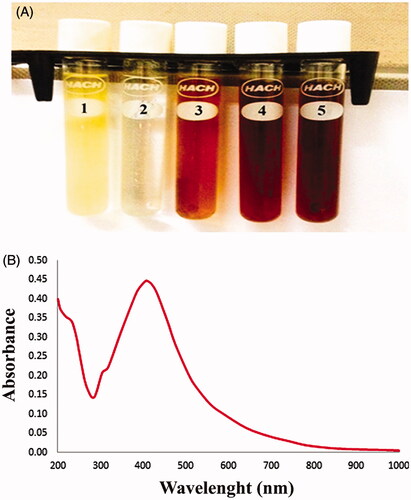
Figure 2. Morphological and structural characters of silver nanoparticles (AgNPs). (A) Scanning electron microscopy image of AgNPs. (B) Zeta potential of AgNPs. (C) DLS analysis of prepared AgNPs. (D) FTIR of AgNPs. (E) XRD pattern of AgNPs.
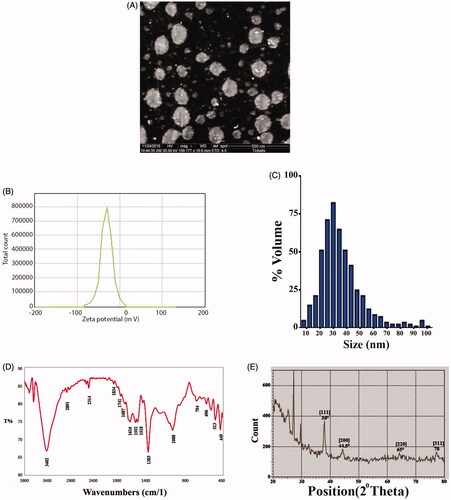
Figure 3. Antioxidant activity of silver nanoparticles (AgNPs). (A) AgNPs decrease catalase enzyme activity. (B) AgNPs augmented lactate dehydrogenase (LDH) release. Data are represented as mean ± SEM of three independent experiment. Asterisks indicate statistical different from untreated cells. *p≤.05; **p≤.01; ***p≤.001; ****p≤.001.

Figure 4. Silver nanoparticles inhibit the proliferation of MCF-7 and HeLa cells. Data are represented as mean ± SEM of three independent experiments. Asterisks indicate statistical different between HeLa and MCF-7 cells. **p≤.01.
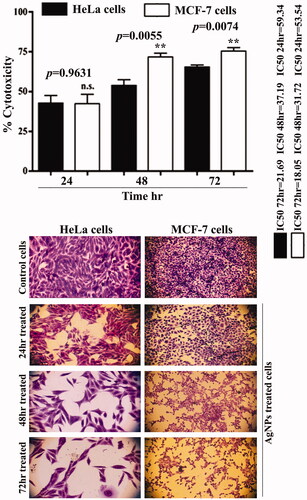
Figure 5. Silver nanoparticles induce apoptosis in MCF-7 and HeLa cells. (A) DNA-fragmentation assay. (B) Immunofluorescent results for P53 protein expression.
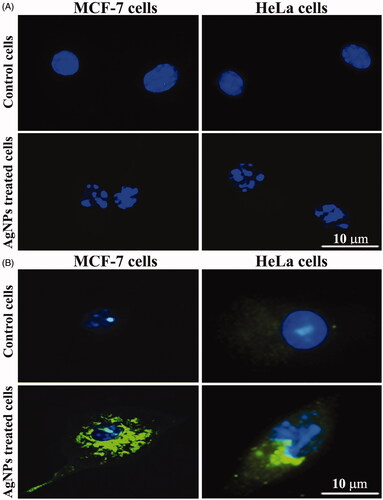
Figure 6. Silver nanoparticles inhibit the inflammation process. (A) Level of IL-1beta in vitro assay. Asterisks inside the column indicate statistical differences from the basal. Asterisks outside the column indicate statistical differences from lactate dehydrogenase (LPS)+adenosine triphosphate (ATP) treated cells. (B) Level of IL-1beta in vivo assay. Asterisks inside the column indicate statistical differences from basal. While, asterisks outside the column indicate statistical different from LPS treated cells. Results are represented as the mean ± SEM of three independent results. **p≤.01 and ***p≤.001.
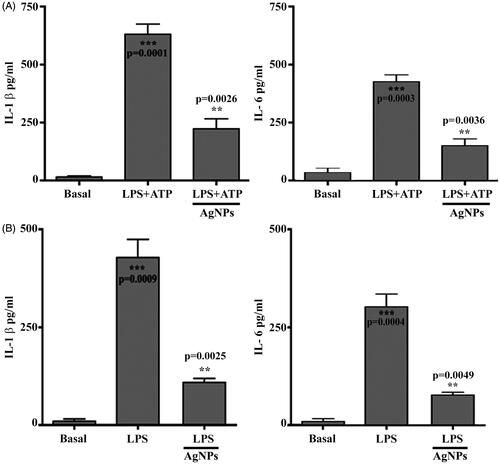
Figure 7. Anti-allergic activity of silver nanoparticles (AgNPs). (A) AgNPs reduce percentage of eosinophil count. (B) AgNPs reduce IgE level. (C) AgNPs reduce IFN-γ level. Asterisks inside the column indicate statistical differences from the basal. While, asterisks outside the column indicate statistical differences from dexamethasone and AgNPs treated animals. Data are represented as mean ± SEM of three independent experiment. *p≤.05, **p≤.01 and ***p≤.001. (D) Photomicrographs of sections of the lung tissue were showed as: (1) a normal control group. (2) Asthmatic animal group. (3) Dexamethasone treated group. (4) AgNPs treated group. Magnification power ×40.
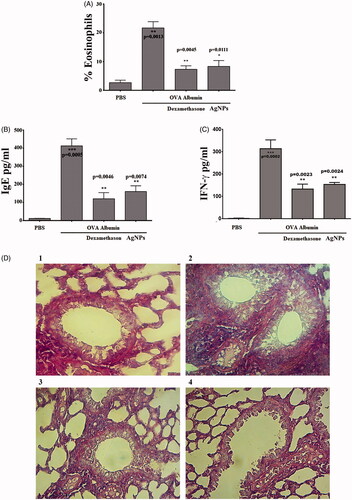
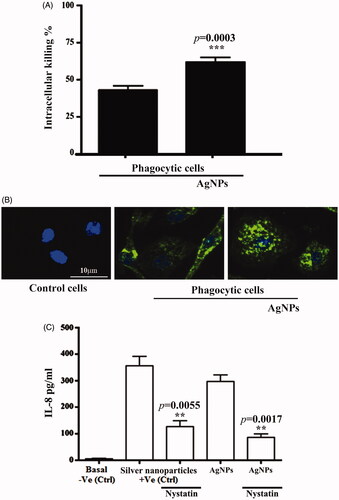
Figure 8. Silver nanoparticles (AgNPs) enhanced phagocytosis. (A) AgNPs increase intracellular killing index in macrophage cells. (B) AgNPs augment bone marrow-derived macrophages in phagocytosis of pHrodo S. aureus BioParticles. (C) AgNPs increase IL-8 concentration in phagocytic cells with commercial Ag nanoparticles used as a positive control. Data are represented as mean ± SEM of three independent experiments. Asterisks indicate statistical different in the presence and absence of AgNPs. **p≤.01 and ***p≤.001.