Figures & data
Scheme 1. Schematic illustration for preparation of FTY720@T7-SF-Se NPs.
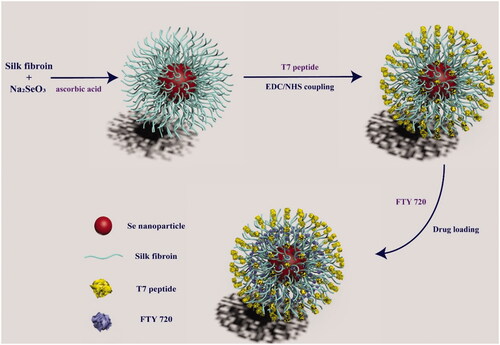
Figure 1. Characterisations of the prepared NPs: TEM images of SF-Se NPs (A) and T7-SF-Se NPs (B); Zeta potential of the SF-Se NPs and T7-SF-Se NPs (C); The hydrodynamic size distribution graphs of SF-Se NPs (D) and T7-SF-Se NPs (E); Stability of SF-Se NPs and T7-SF-Se NPs at room temperature (F).
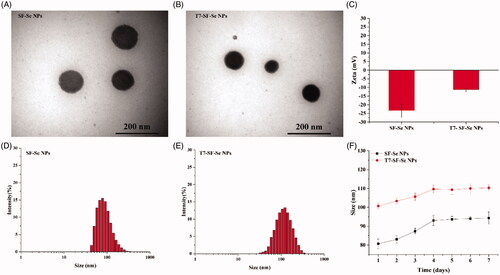
Table 1. Characterisations of FTY720@T7-SF-Se NPs at 25 °C.
Figure 2. In vitro release profiles of FTY720 from FTY720@T7-SF-Se NPs under different conditions: (A) Samples were measured in different pH environments at 37 °C; (B) Samples were measured at different ionic strengths at 25 °C, pH7.4.
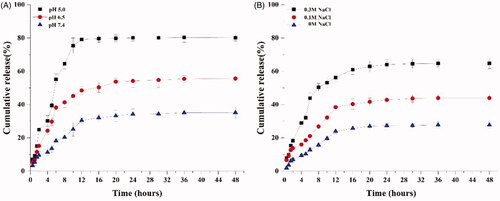
Figure 3. Cell viability of (A) 3T3 cells and (B) K1 cells cocultured with various NPs at different concentration. (*p < .05, **p < .01); Haemolysis study of various prepared NPs (C).
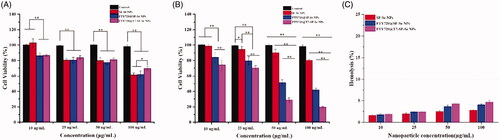
Figure 4. Live and dead cell staining of K1 cells after co-cultured with PBS (Control), FTY720@SF-SeNPs (A), and FTY720@T7-SF-SeNPs (B) for 24 h. Red colour indicates dead cells and green for live cells.
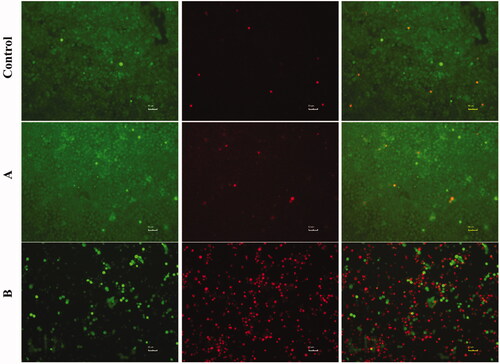
Figure 5. TEM images of K1 cells incubated with FTY720@SF-Se NPs (A) and FTY720@T7-SF-Se NPs (B) after 8 h.
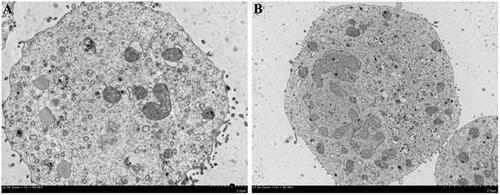
Figure 6. Confocal images of K1 cells incubated with the prepared NPs (blue colour indicates cell nucleus and red for the Cy 5.5 labelled nanoparticles): (A) Cy5.5-labelled FTY720@SF-Se NPs, and (B) Cy5.5-labelled FTY720@T7-SF-Se NPs (B) after 6 h.
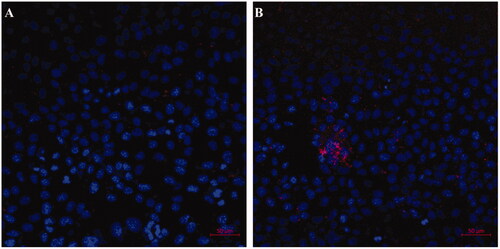
Figure 7. In vivo near-infrared fluorescence images of K1 tumour-bearing nude mice after injection with Cy5.5-labled SF-Se NPs FTY720@ SF-Se NPs (A), or FTY720@T7-SF-Se NPs (B) at 2, 6, 12, 24 and 48 h; ex vivo images of major organs and tumours collected at 48 h post-injection with Cy5.5-labled FTY720@ SF-Se NPs (C), or FTY720@T7-SF-Se NPs (D); fluorescence intensities measured from in vivo images of nude mice (E) and ex vivo images of major organs and tumours (F).
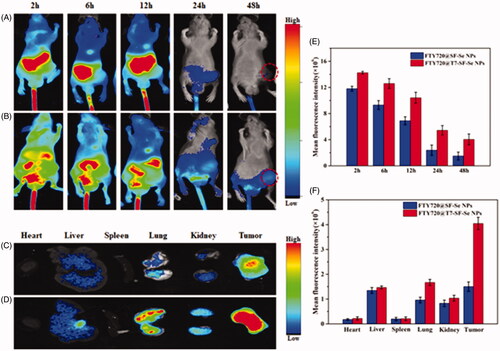
Figure 8. In vivo antitumor therapeutic effects of FTY720@T7-SF-Se NPs. The K1 tumour-bearing nude mice were intravenously injected with saline as the (a) control group, (b)FTY720@SF-Se NPs, and (c)FTY720@T7-SF-Se NPs: the images of tumour growth in vivo (A); the images of dissected tumours from the mice after last injection with the prepared NPs (B); the changes in body weight (C) and the tumour volume (D) of K1 tumour-bearing nude mice. Data were shown as mean ± SD.
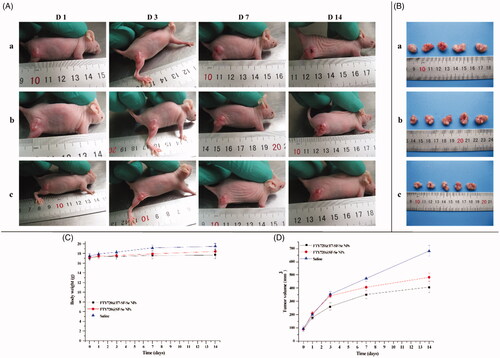
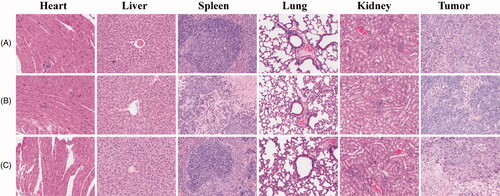
Figure 9. HE staining images of major organs and tumour tissues of mice. The tumour bearing mice were treated with saline (A), FTY720@SF-Se NPs (B), and FTY720@T7-SF-Se NPs (C), respectively.