
Figures & data
Figure 1. The fraction of 22 subsets of immune cells in carotid atherosclerotic plaque from early stage and advanced stage. (A) Early stage plaques; (B) advanced stage plaques. X axis: each GEO sample; Y axis: percentage of each kind of immune cells.
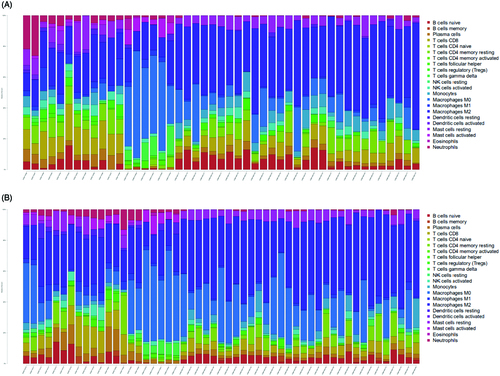
Figure 2. The violin graph shows the difference of immune infiltration between early stage plaques and advanced stage plaques. The early stage plaque group is shown in blue and advanced stage plaque group is shown in red. p-Value < .05.
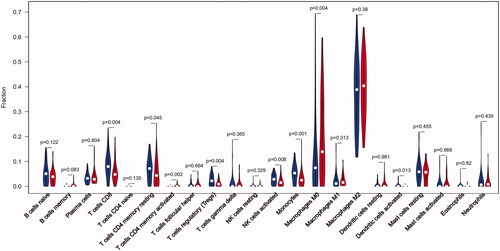
Figure 3. The co-expression patterns among fractions of immune cells. Red: positive correlation; blue: negative correlation.
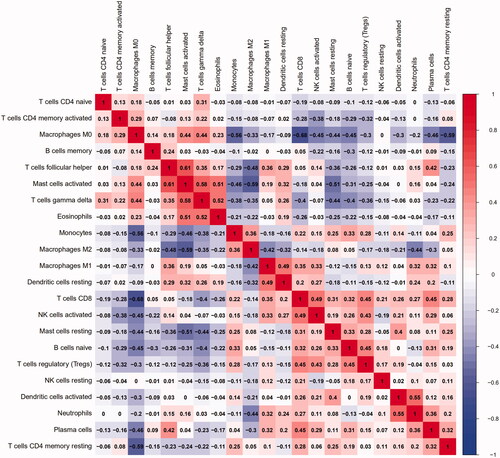
Figure 4. Principal components analyses performed on plaque samples.
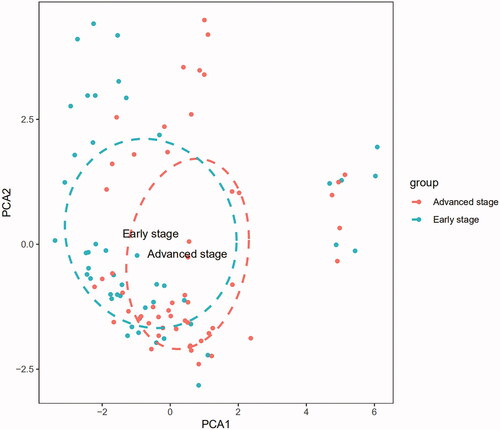
Figure 5. Results of GO and KEGG from GSEA. (A and B) 10 representative enriched immune-related GO gene sets; (C and D) 10 representative enriched immune-related KEGG pathways. GSEA: Gene set enrichment analysis; GO: gene ontology; KEGG: Kyoto Encyclopaedia of Genes and Genomes.
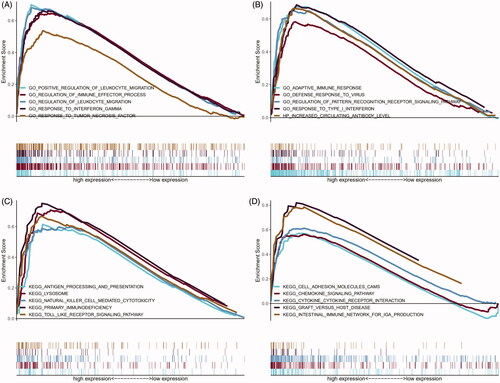
Table 1. Top 20 significant KEGG pathways enriched by DEGs in GSEA, p < .05.
Table 2. Top 20 significant GO terms enriched by DEGs in GSEA, p < .05.
Figure 6. Heatmap of all DEGs between early stage and advanced stage plaques. Each column represents a carotid atherosclerotic plaque sample, and each row represents a DEG. The gradual colour change from blue to orange indicates the changing process from downregulation to upregulation. DEGs: differentially expressed genes.
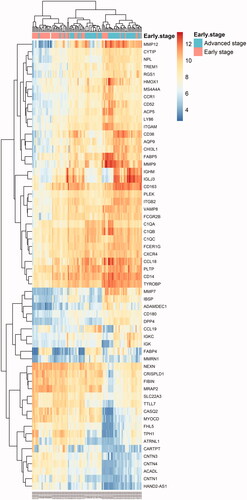
Figure 7. (A) The top six significant GO terms enriched by DEGs; (B) the top six significant KEGG pathways enriched by DEGs.
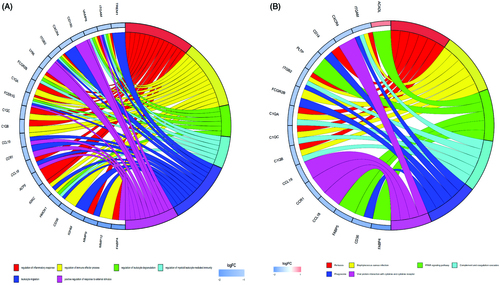
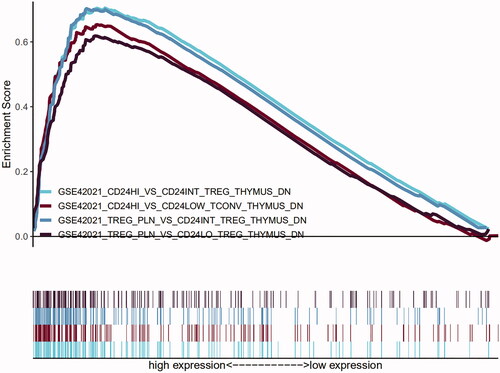
Table 3. Top 20 significant immunological signature enriched by DEGs in GSEA, p < .05.
Figure 8. Four representative enriched immunological signature gene sets, including GSE42021 CD24hi vs. CD24int Treg thymus down; GSE42021 CD24hi vs. CD24LOW Tconv thymus down; GSE42021 Treg PLN vs. CD24int Treg Thymus down; GSE42021 Treg PLN vs. CD24lo Treg thymus down.
Data availability statement
All raw data are available in GEO datasets (GSE28829, GSE41571, and GSE43292).