
Figures & data
Table 1. Reported studies on therapeutic agents used for cancer treatment in the past 5 years.
Table 2. Detailed preparation of chemo drug under various binding conditions.
Figure 1. (a) Absorbance and (b) calibration curve at the various concentrations of DPPH*. A, B, C, D, E, F, G, H, I and J represent 10, 20, 30, 40, 50, 60, 70, 80, 90 and 100 µM of DPPH*, respectively.
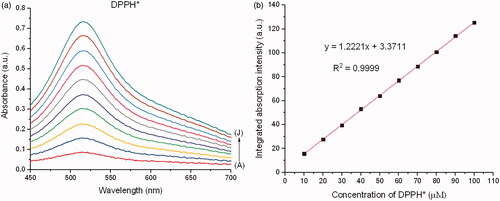
Figure 2. TEM images of the formulated chemo drugs: (a) ZnO, (b) DOX + ZnO, (c) CP + ZnO and (d) CP + DOX + ZnO. CP: carboplatin; DOX: doxorubicin; ZnO: zinc oxide nanoparticles.
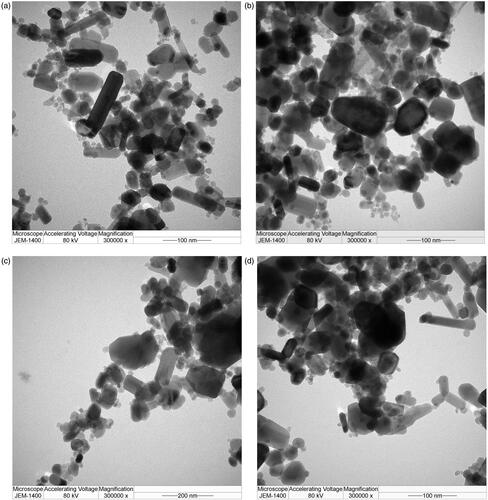
Table 3. Quantities of chemo drug in DPPH*.
Figure 3. FTIR spectra of the formulated chemo drugs before UV-irradiation on DPPH*.
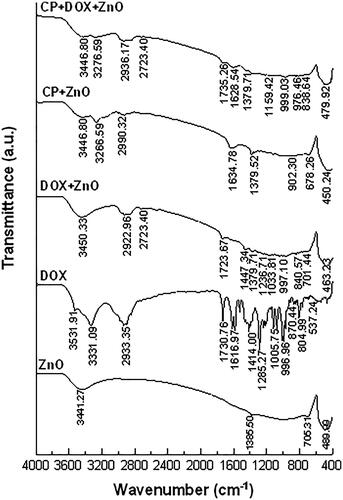
Figure 4. (a) Absorbance, (b) fluorescence and (c) fluorescence quantum yield of DOX, before and after ZnO adsorption at a reaction time of 0 min. A, B, C, D and E represent 5.39, 2.69, 1.35, 0.67 and 0.34 µM of DOX, respectively. (d) Absorbance, (e) fluorescence and (f) fluorescence quantum yield of CP + DOX, before and after ZnO adsorption at a reaction time of 0 min. Notably, DOX or CP + DOX remained in the supernatant after facilitating adsorption to the drug-loaded nanoparticle complexes. Absorbance and fluorescence peaks are centred at 485 and 594 nm, respectively. See Ref. [Citation24] for detailed equations of fluorescence quantum yield.
![Figure 4. (a) Absorbance, (b) fluorescence and (c) fluorescence quantum yield of DOX, before and after ZnO adsorption at a reaction time of 0 min. A, B, C, D and E represent 5.39, 2.69, 1.35, 0.67 and 0.34 µM of DOX, respectively. (d) Absorbance, (e) fluorescence and (f) fluorescence quantum yield of CP + DOX, before and after ZnO adsorption at a reaction time of 0 min. Notably, DOX or CP + DOX remained in the supernatant after facilitating adsorption to the drug-loaded nanoparticle complexes. Absorbance and fluorescence peaks are centred at 485 and 594 nm, respectively. See Ref. [Citation24] for detailed equations of fluorescence quantum yield.](/cms/asset/c71f6782-a492-4f76-9282-75001cefe956/ianb_a_1876718_f0004_c.jpg)
Table 4. Representative drug release rate of CP + DOX + ZnO + UV under different binding ratios (pH = 6.0).
Figure 5. Integrated absorption intensities of DPPH* caused by (a) DOX, (b) DOX + ZnO and (c) DOX + ZnO + UV as a function of reaction time from 0 to 720 min at different concentrations of DOX. Disappearance of DPPH* caused by (d) DOX, (e) DOX + ZnO and (f) DOX + ZnO + UV as a function of reaction time from 0 to 720 min at different concentrations of DOX. Molar ratio of ZnO to DOX is 5:1. A, B, C, D and E represent 5.39, 2.69, 1.35, 0.67 and 0.34 µM of DOX, respectively.
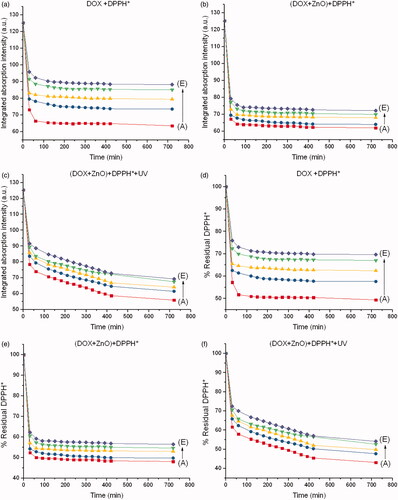
Figure 6. Integrated absorption intensities of DPPH* caused by (a) CP, (b) CP + ZnO and (c) CP + ZnO + UV as a function of reaction time from 0 to 720 min at different concentrations of CP. Disappearance of DPPH* caused by (d) CP, (e) CP + ZnO and (f) CP + ZnO + UV as a function of reaction time from 0 to 720 min at different concentrations of CP. Molar ratio of ZnO to CP is 5:1. A, B, C, D and E represent 16.31, 15.78, 14.73, 12.63 and 8.42 µM of CP, respectively.
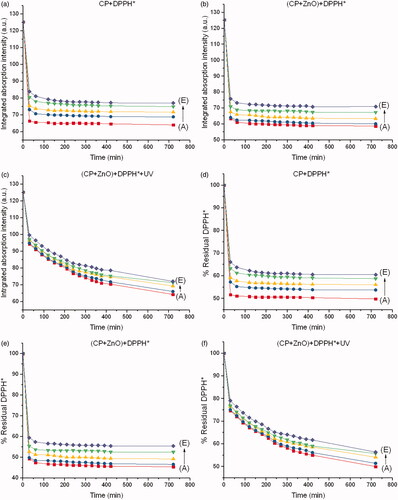
Figure 7. Integrated absorption intensities of DPPH* caused by (a) CP + DOX, (b) CP + DOX + ZnO and (c) CP + DOX + ZnO + UV as a function of reaction time from 0 to 720 min at different ratios of CP and DOX. Disappearance of DPPH* caused by (d) CP + DOX, (e) CP + DOX + ZnO and (f) CP + DOX + ZnO + UV as a function of reaction time from 0 to 720 min at different ratios of DOX and CP. Molar ratio of ZnO to (CP + DOX) is 5:1. A, B, C, D and E represent CP:DOX = 1:1, 3:1, 7:1, 15:1 and 31:1, respectively.
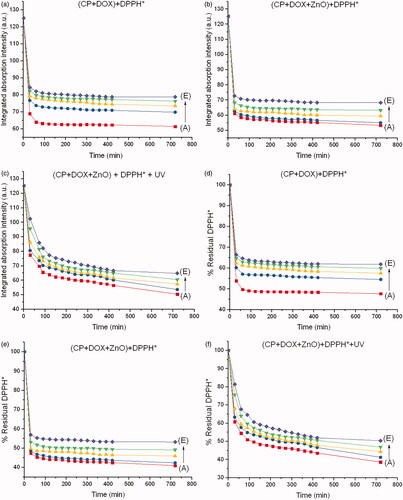
Figure 8. Disappearance of DPPH* at a steady state with respect to drug-DPPH*. (a) Molar ratio of ZnO to DOX is 5:1. (b) Molar ratio of ZnO to CP is 5:1. (c) Molar ratio of ZnO to (CP + DOX) is 5:1. IC50 value of each formulated chemo drug is also presented.
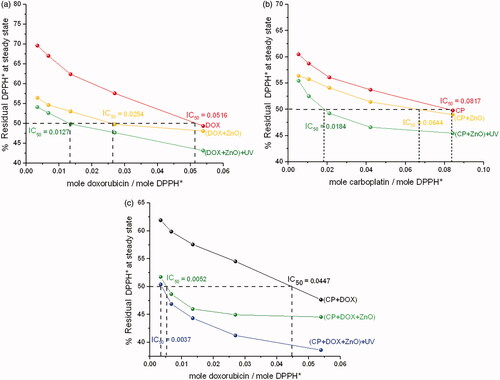
Table 5. Comparative cytotoxicity of chemo drug in DPPH* in comparison to human cancer cell lines from triplicate experiments, p<.05 using ANOVA followed by the Bonferroni post hoc test.
Figure 9. (a) Phase contrast images of human normal cell lines (HaCat) after incubation for 24 h under UV light. (b) Fluorescence image of human normal cell lines (HaCat) after incubation for 24 h in the presence of CP + DOX + ZnO + UV. Cytoplasm of live cells is shown in red. Scale bar indicates 50 µm.
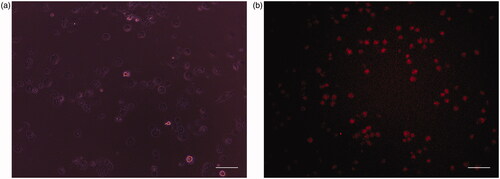
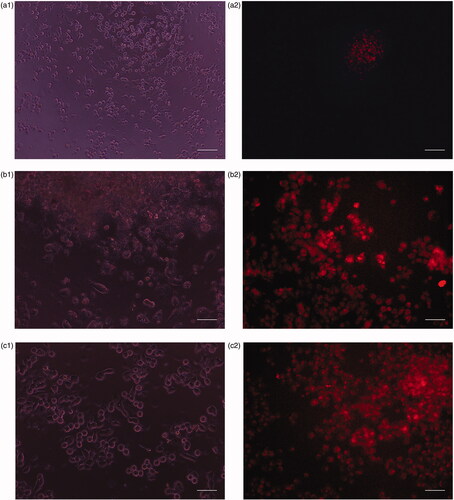
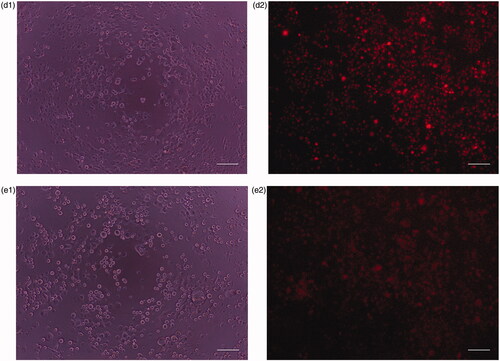
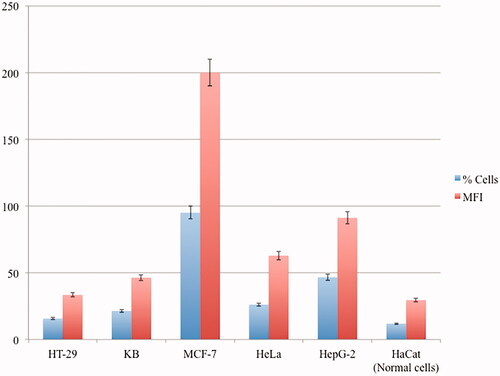
Figure 11. Representative median fluorescence intensity (MFI) and the percentages of cellular apoptosis treated by CP + DOX + ZnO + UV from three independent experiments analysed by flow cytometry, p<.05 using ANOVA followed by the Bonferroni post hoc test.
Data availability statement
All data and material used to support the findings of this study are included within the article.