
Figures & data
Table 1. Primer list.
Figure 1. FE-SEM image of synthesized nanoparticles, scaffolds, and the corresponding diameter distributions (A) PCL-PEG-PCL-Col; (B) PCL-PEG-PCL-Col/nHA; (C) Nano hydroxyapatite particles. EDX; (D) synthesized nano-hydroxyapatite particles; (E) PCL-PEG-PCL-Col/nHA.
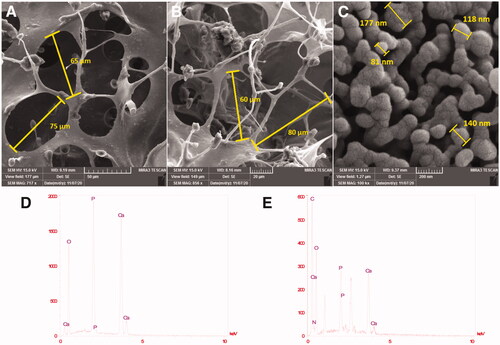
Figure 2. XRD patterns for PCL-PEG-PCL-Col/nHA; the characteristic peaks of hydroxyapatite were detected at 2θ = 32°, 38, 46°, 56°, and 67°.
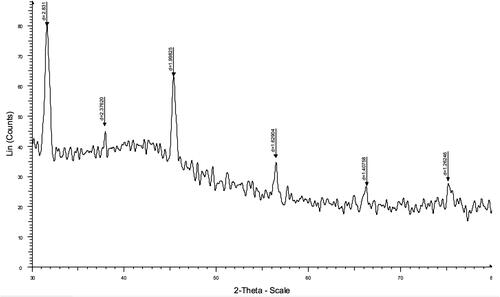
Figure 3. FTIR spectra for (A) PCL-PEG-PCL-Col; (B) PCL-PEG-PCL-Col/nHA.
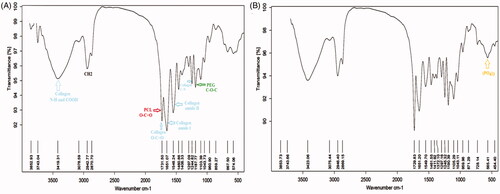
Figure 4. H-NMR spectra of (A) PCL-PEG-PCL-COL/nHA; (B) C-NMR spectra of PCL-PEG-PCL-COL/nHA.
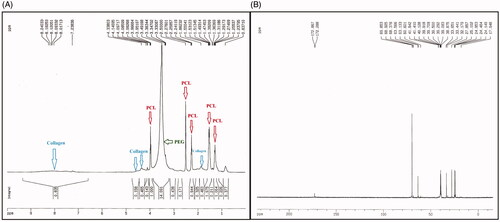
Figure 5. The sol-gel transition of PCL-PEG-PCL-Col and PCL-PEG-PCL-Col/nHA scaffolds.
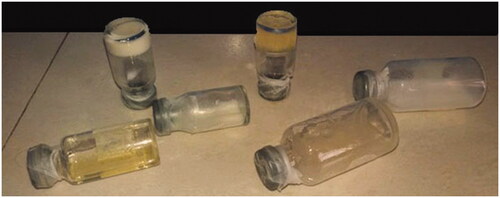
Figure 6. Alizarin red staining of MSCs seeded on PCL-PEG-PCL-COL and PCL-PEG-PCL-COL/nHA hydrogels after 14 days with a magnification of 200 μm. The calcium content of the nano-hydroxyapatite contained hydrogels was significantly higher than in other groups. (***p < .001).
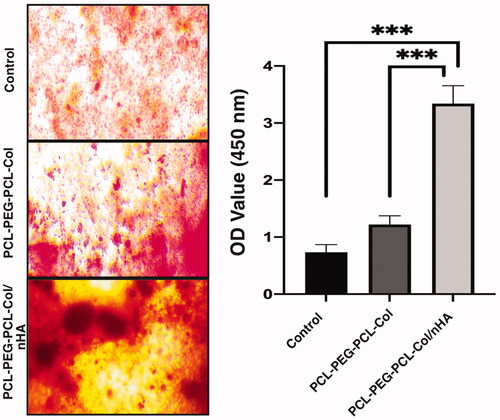
Figure 7. Gross and histological examination of the transplantation site after 14 days (A–C). In group PCL-PEG-PCL, the transplant mass was considerably biodegraded while PCL-PEG-PCL-Col and PCL-PEG-PCL-Col/nHA exhibited a slow biodegradation rate. Bright-field imaging showed the lack of PCL-PEG-PCL substrate beneath the epidermis while remnants of PCL-PEG-PCL-Col and PCL-PEG-PCL-Col/nHA were surrounded by fibrotic tissue. These data showed the stability of PCL-PEG-PCL-Col and PCL-PEG-PCL-Col/nHA hydrogels in in vivo conditions after 14 days.
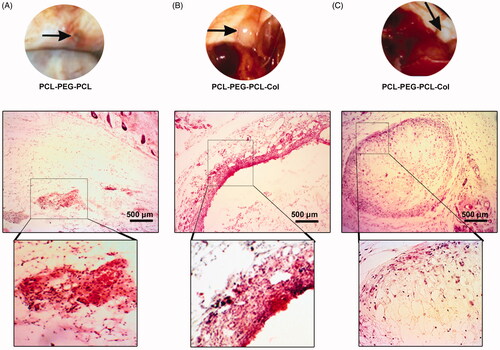
Figure 8. (A) Measuring the levels of local CD68 positive cells and (B) blood CD8/CD4 lymphocyte ratio using IF staining. Data showed the lack of statistically significant differences in the levels of CD68 cells and CD8/CD4 lymphocyte ratio between the groups. These data showed that PCL-PEG-PCL-Col and PCL-PEG-PCL-Col/nHA hydrogels well-tolerated in vivo without a magnificent immune system reaction.
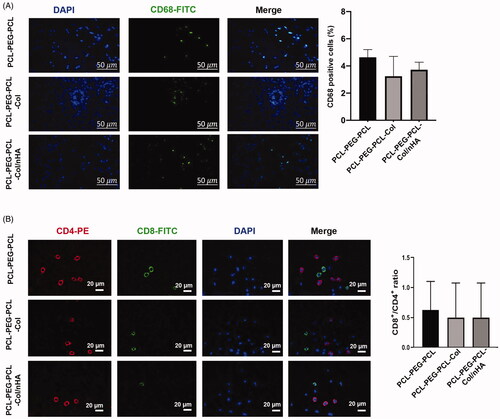
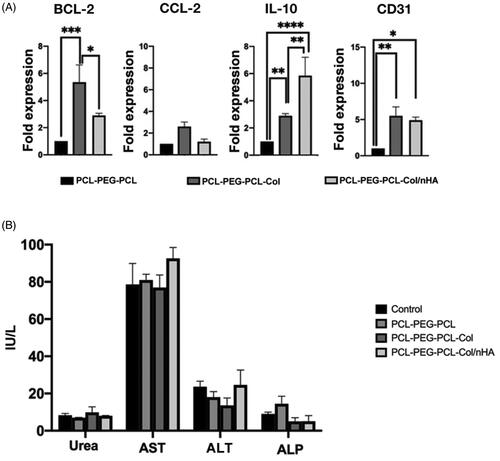
Figure 9. (A) Measuring the expression of BCL2, CCl-2, IL10, and CD31 in subcutaneous transplants after 14 days using real-time PCR assay (n = 6). (B) Serum levels of AST, ALT, ALP, and Urea in PCL-PEG-PCL, PCL-PEG-PCL-Col, and PCL-PEG-PCL-Col/nHA groups after 14 days (n = 6). *p < .05, **p < .01, ***p < .001, and ****p < .0001.
Data availability statement
The data that support the findings of this study are available from the corresponding author, [Dr. Aghazadeh and Dr. Alipour], upon reasonable request.