Figures & data
Table 1. Compositions of the formation of PEG-penetrated F127/CMCS hydrogel.
Figure 1. TEM image of ALA-NLC.
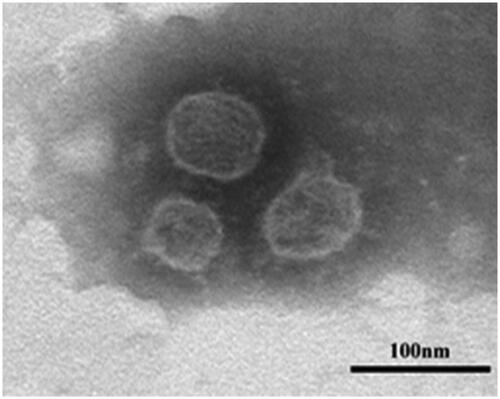
Figure 2. TGA thermogram of ALA and soybean lecithin.
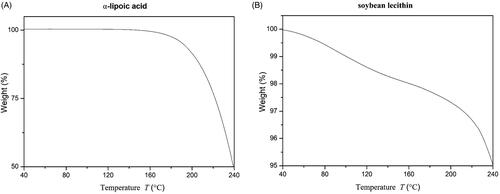
Table 2. Physicochemical parameters of formulated ALA-NLC.
Figure 3. FTIR spectrum of (A) P407, (B) CMCS, (C) GP-CMCS/P407 hydrogel and (D) GP.
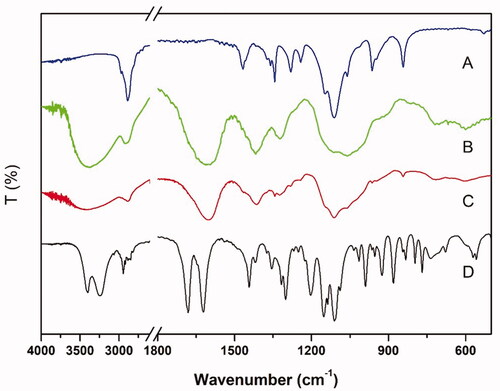
Figure 4. SEM images of the lyophilised PEG-interpenetrated CMCS/P407 hydrogels. (A) 0% PEG; (B) 0.5% PEG; (C) 1.5%PEG; (D) 2.0% PEG.
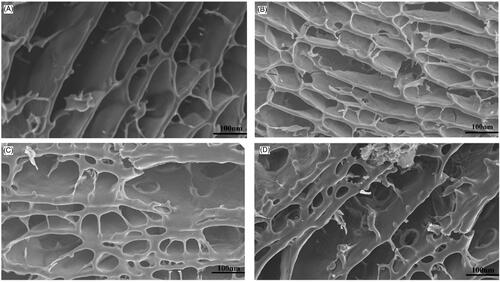
Figure 5. Rheological characterisation of five PEG-interpenetrated CMCS/P407 hydrogel. (A) Shear stress; (B) Viscosity variation.
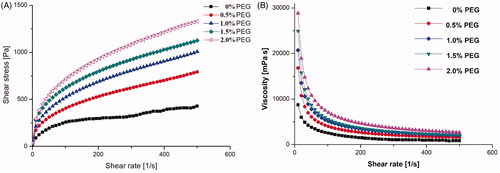
Figure 6. Swelling characteristic of the hydrogels CMCS/P407 hydrogel (a) in different test conditions (b) with gradient amount of PEG 4000 at pH 6.5, 35 °C (mean ± SD, n = 3).
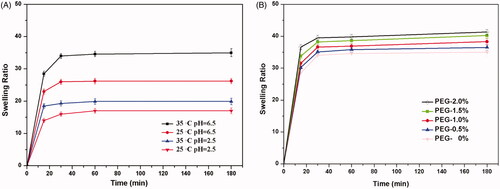
Figure 7. The in-vitro dissolution profiles of α-lipoic acid from various formulations at pH 6.5, 35 °C (mean ± SD, n = 3).
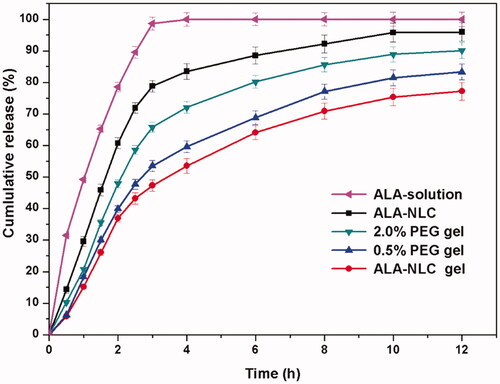
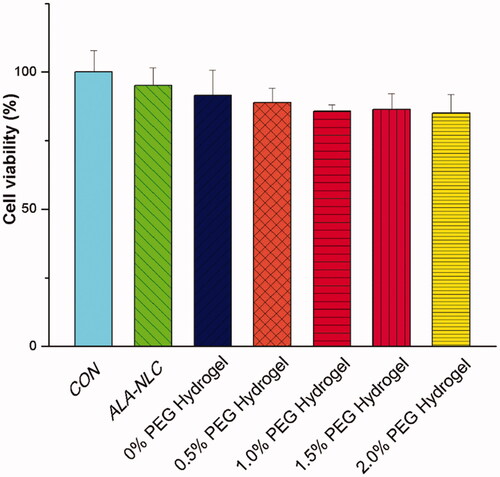
Figure 8. After 24 h incubation, CCK8 cell viability assay results of the hydrogels (mean ± SD, n = 3).