
Figures & data
TABLE 1. Effect of phytochemical tests of MLE.
Figure 1. Image of (A) MLE have green colour due to the presence of UV active natural product, (B) Silver Solution are colourless due to the UV inactive ions (C) AgNPs having brown colour due to the surface plasmon resonance (D) Gold solution having no colour due the UV inactive ions of gold and (E) AuNPs having pink colour due to the surface plasmon resonance.
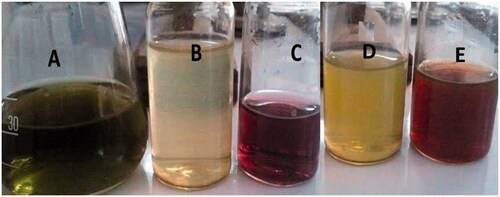
Figure 2. UV-Visible spectrum of (A) AgNPs and (B) AuNPs of MLE.
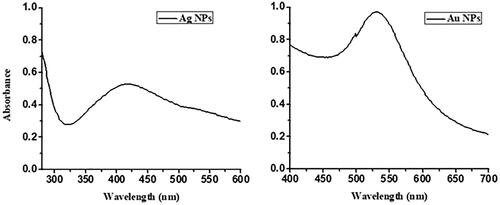
Figure 3. FTIR spectrum recorded for (A) MLE, (B) AgNPs and (C) AuNPs.
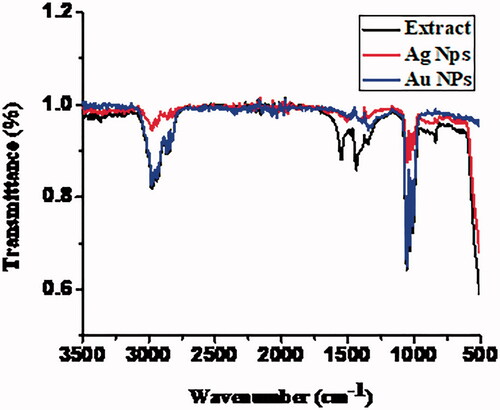
Table 2. FTIR spectral analysis of MLE, and AuNPs and AgNPs.
Figure 4. Atomic force microscopy images of (A) AgNPs) and (B) AuNPs of MLE.
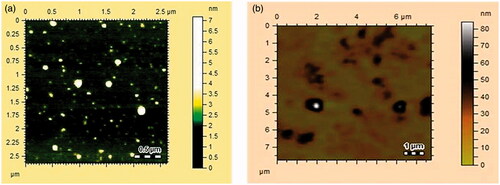
Figure 5. TEM images of (A) showing particles size distribution of AgNPs (B) Average particles size and size distribution of AgNPs.
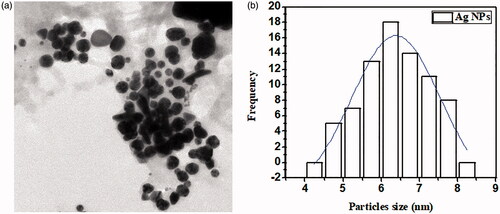
Figure 6. TEM images of (A) showing particles size distribution of AuNPs (B) Average particles size and size distribution of AuNPs.
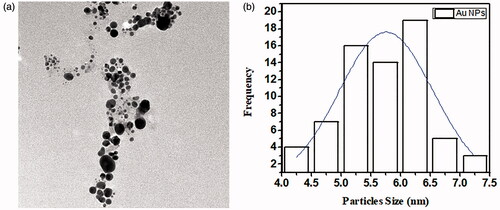
Figure 7. DPPH radical scavenging activity of MLE and NPs with 20–150 µg/mL. The results are presented as mean ± SEM of three different readings SEM: standard error mean.
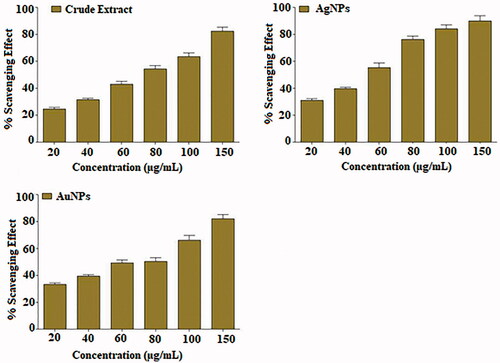
Table 3. Antibacterial activity of MLE and AuNPs and AgNPs.
Figure 8. Effect of intraperitoneal administration of AuNPs and AgNPs in acetic acid induced test. Values are expressed as mean ± SEM *p<.05, **p<.01, ***p<.001 as compared to control. n = 6.
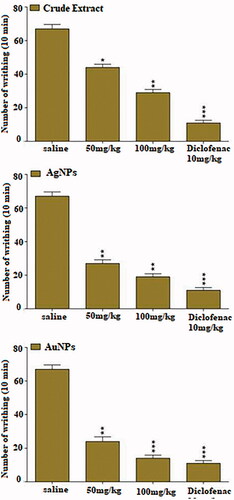
Table 4. Sedative effect of MLE and NPs in open field test (Locomotive activity).