
Figures & data
Table 1. The list of primers used in the study.
Figure 1. Assessment of Hc-CuONPs by UV method.
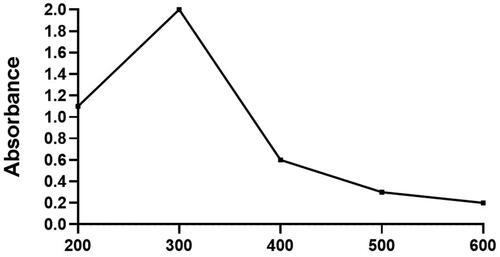
Figure 2. Analysis of Hc-CuONPs using FTIR.
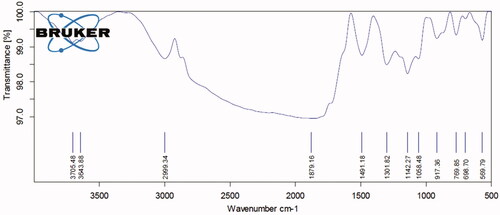
Figure 3. Analysis of Houttuynia cordata crude extract using FTIR.
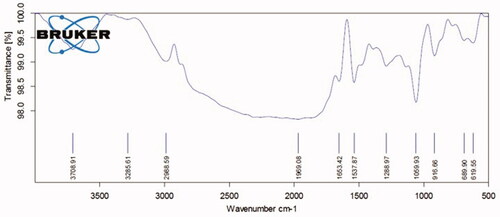
Figure 4. Analysis of Hc-CuONPs using HR-TEM and XRD analysis.
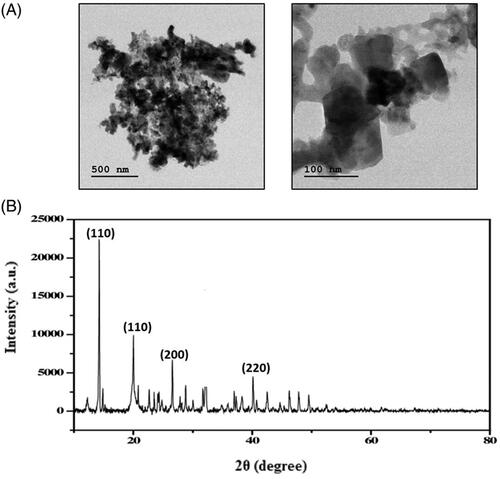
Figure 5. In vitro cytotoxic effects of Hc-CuONPs in normal L929 cells. L929 cells were treated with different concentrations of Hc-CuONPs (1–20 µg/ml) for 24 h and viability was analysed using MTT assay. Viability was calculated as a percentage of decrease or increase over the control. Data are expressed as mean ± SD triplicate measurement.
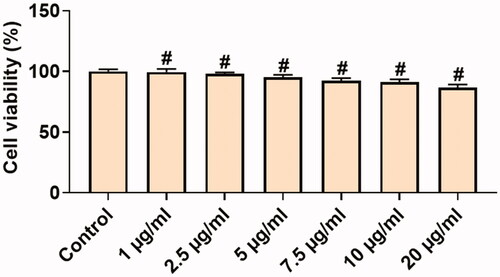
Figure 6. In vitro cytotoxic effects of Hc-CuONPs in cervical cancer HeLa cells. HeLa cells were treated with different concentrations of Hc-CuONPs (1–20 µg/ml) for 24 h and viability was analysed using MTT assay. Viability was calculated as a percentage of decrease or increase over the control. Data are expressed as mean ± SD triplicate measurement. The black arrows indicate the dead cells and the red arrows indicate the viable cells.
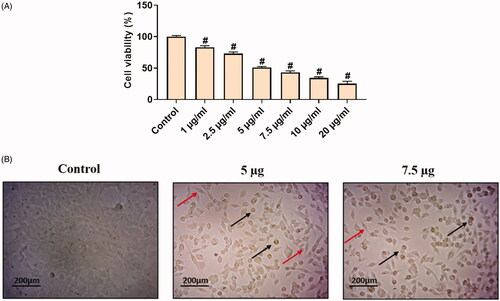
Figure 7. Analysis of ROS by DCFH-DA staining method. HeLa cells were treated with different concentrations of Hc-CuONPs (5 and 7.5 µg) and then stained with DCFH-DA solution. ROS production was evaluated by fluorescence microscopy. Control cells possessed lower green fluorescence, Hc-CuONPs (5 and 7.5 µg) possessed bright and visible green fluorescence in HeLa cells (yellow arrows).
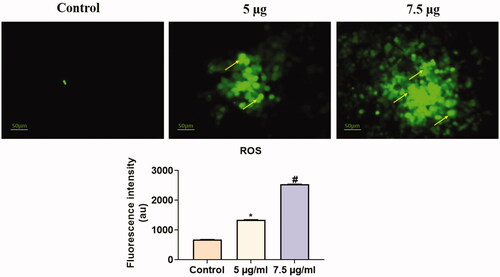
Figure 8. Detection of live and dead cell population by AO/EtBr double staining. HeLa cells were treated with different concentrations of Hc-CuONPs (5 and 7.5 µg) and then stained with AO/EtBr solution. Apoptotic cell death was evaluated by fluorescence microscopy. Viable cells show uniformly green fluorescence (white arrows). Hc-CuONPs treated cells shows with chromatin condensation, indicating early and late apoptosis with uniformly in bright yellow (red arrows).
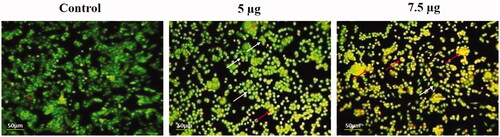
Figure 9. Detection of nuclear changes by Rh-123 and DAPI staining. HeLa cells were treated with different concentrations of Hc-CuONPs (5 and 7.5 µg) and then stained with Rh-123 and DAPI stains, respectively. Control cells show normal mitochondrial matrix and viable cells. Hc-CuONPs treated cells possess the decreased mitochondrial membrane potential and apoptotic cell deaths in the HeLa cells (white arrows).
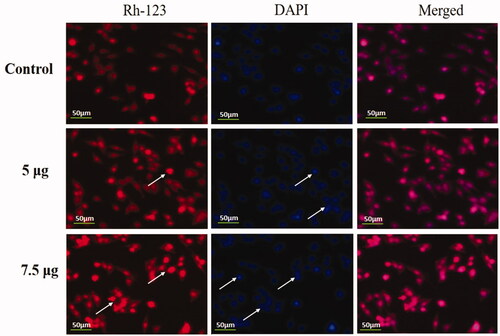
Figure 10. Identification of apoptotic cells by propidium iodide staining. HeLa cells were treated with different concentrations of Hc-CuONPs (5 and 7.5 µg) and then stained with propidium iodide solution. Apoptotic cell death was evaluated by fluorescence microscopy. Viable cells show very mild red fluorescence. Hc-CuONPs treated cells show apoptotic cell death with bright red fluorescence (white arrows).
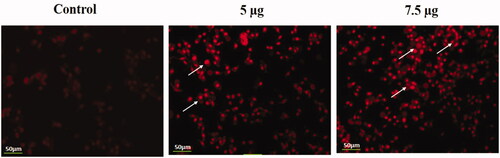
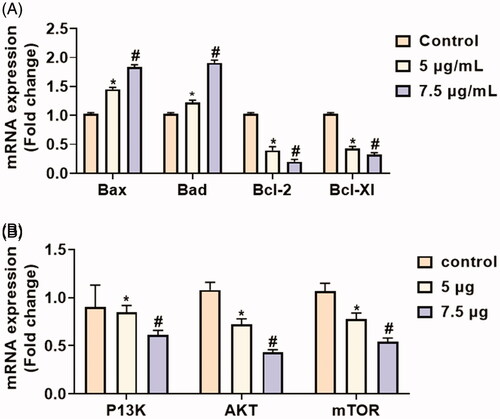
Figure 11. Effect of Hc-CuONPs in HeLa cells apoptotic and anti-apoptotic gene expressions and PI3K/AKT/mTOR signalling proteins using real time PCR. Each value is mean ± SD of triplicate measurements. *p<.05, #p<.001 comparisons between the control and experimental groups.
Data availability statement
The data used to support the findings of this study are available from the corresponding author upon request.