
Figures & data
Figure 1. Schematic presentations of preparation of triamcinolone acetonide-loaded PLGA-Chitosan polymer nanoparticles. The PLGA was prepared by solvent-evaporated method and chitosan was coated by electrostatic interactions.
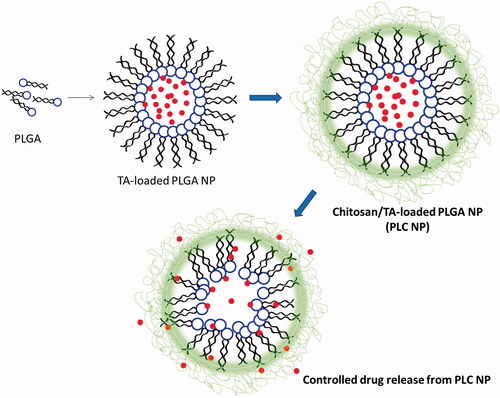
Figure 2. (a) Change in particle size and polydispersity index; (b) change in zeta potential; (c) optimization of PLGA-chitosan NP in terms of particle size; (d) optimization in terms of zeta potential. **p < 0.01 and ***p < 0.0001.
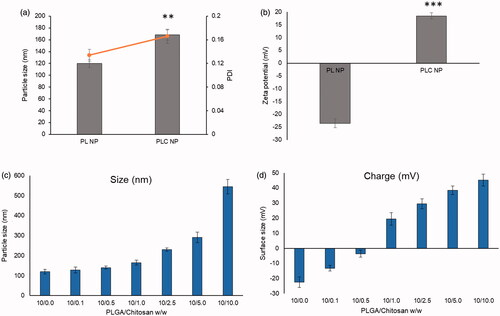
Figure 3. Transmission electron microscope-based morphology analysis of PL NP and PLC NP.
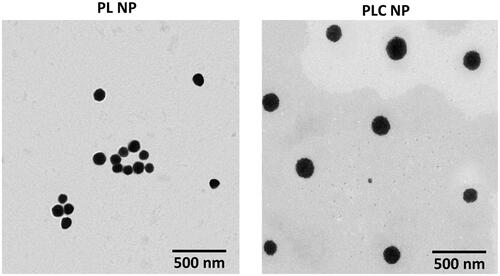
Figure 4. (a) Stability analysis of PL NP and PLC NP over 45 days at 4 °C. The stability was performed in terms of particle size; (b) in vitro release characteristics of triamcinolone acetonide from PL NP and PLC NP at 37 °C. The release was quantified using HPLC technique.
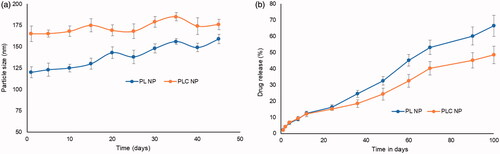
Figure 5. (a) MTT assay of blank PLC NP, PLC-TA (0.1%) and PLC-TA (1%) in HCE cells. The experiments were performed in triplicate (b) MTT assay on the free TA suspensions. *p < 0.05.
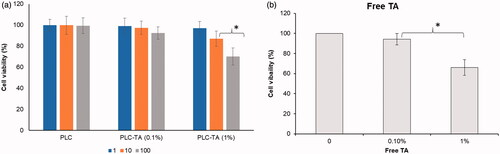
Figure 6. (a) In vitro corneal permeation analysis of free TA and PLC-TA for a time period ranging from 0.5 to 3 h, respectively; (b) ELISA based quantification of IL-6 secretion by TNFa activated HCE cells after treatment with free TA suspensions and PLC-TA formulations. *p <0.05, **p < 0.01 and ***p < 0.0001.
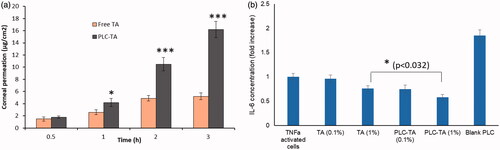
Figure 7. (a) Clinical inflammatory score of rabbit treated with normal saline, TA suspension and PLC-TA formulations at 0.1 and 1% concentrations; (b) percentage of aqueous humour transparency (%AHT) in the EIU model after 24–72 h. **p < 0.01 and ***p < 0.0001.
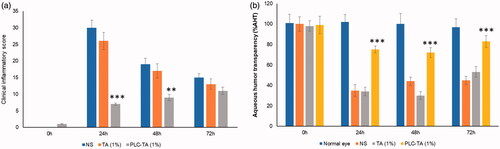
Figure 8. Pharmacokinetic analysis of plasma concentration of TA after ophthalmic administration of free TA suspension and PLC-TA. The study was conducted until 24 h and analysed using HPLC technique. ***p < 0.0001.
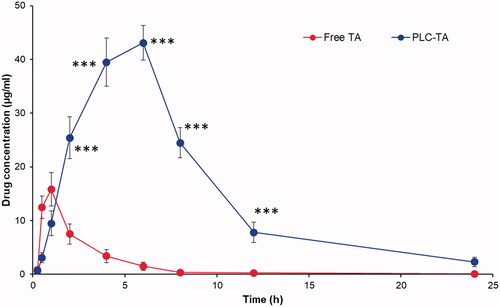
Table 1. Pharmacokinetic parameters after administration of free TA suspension and PLC-TA in rabbit model.