
Figures & data
Figure 1. Characterization of PVA and PVA-H microspheres. (a) The shape (300×) and porous structure (10,000×) micrographs of PVA and PVA-H microspheres by SEM. (b) Bright field, fluorescent and merge photographs of PVA and PVA-H/FITC. For each panel, images from left to right show bright field, fluorescent photographs, and merge of two images, respectively. (c) The XPS wide spectrum of PVA-H and the fitted peak analysis of the XPS for N 1 s and S 2p of PVA-H.
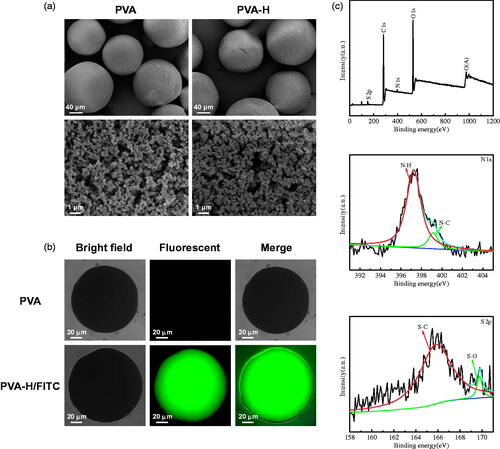
Figure 2. The adsorption characteristics of PVA-H for VEGF, TGF-β and TNF-α in human plasma. (a) Non-linear fitting for the adsorption kinetic data of VEGF onto the two adsorbents in human plasma (T = 37 °C, CVEGF = 1335.21 ± 3.92 pg/mL). (b) Effects of temperature on adsorption of VEGF (t = 2 h, CVEGF = 1152.32 ± 4.23 pg/mL). (c) Non-linear fitting for the adsorption kinetic data of TGF-β onto the two adsorbents in human plasma (T = 37 °C, CTGF-β = 1048 ± 1.24 pg/mL). (d) Effects of temperature on adsorption of TGF-β (t = 2 h, CTGF-β = 1121 ± 2.34 pg/mL). (e) Non-linear fitting for the adsorption kinetic data of TNF-α onto the two adsorbents in human plasma (T = 37 °C, CTNF-α = 1069 ± 3.24 pg/mL). (f) Effects of temperature on adsorption of TNF-α (t = 2 h, CTNF-α = 968 ± 4.25 pg/mL). The plasma to adsorbent ratio was 20 and all values are expressed as mean ± SD (n = 3). ns: not significant, **p < .01, ***p < .001, ****p < .0001.
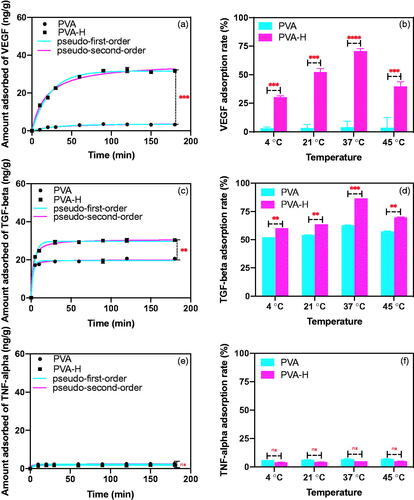
Figure 3. Targeting regulation of the TME in SHZ-88 cells by PVA-H microspheres. (a) Schematic illustration of PVA-H microspheres dynamic targeting experiment. (b) Adsorption rate of different cytokines in the culture supernatants after perfusion through PVA and PVA-H microspheres (T = 37 °C, CVEGF = 490.83 ± 5.32 pg/mL, CTGF-β = 345.92 ± 6.32 pg/mL, CTNF-α = 4.12 ± 1.24 pg/mL the plasma to adsorbent ratio was 20). (c) CCK-8 experiments showed that perfusion through PVA-H microspheres attenuated the proliferative capacity of SHZ-88 cells. All values are expressed as mean ± SD (n = 6). ns: not significant, **p < .01, ***p < .001, ****p < .0001.
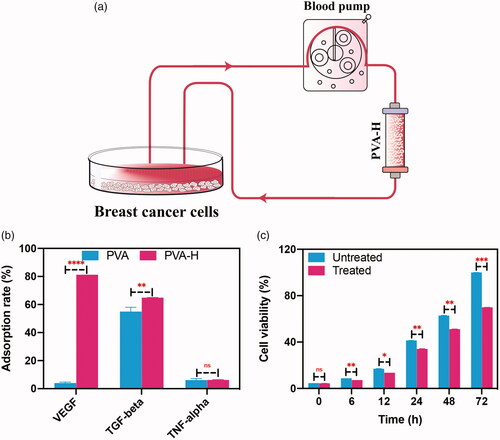
Figure 4. Annexin V–FITC and PI assay. Effect of perfusion through PVA-H microspheres on cell apoptosis. All values are expressed as mean ± SD (n = 3).
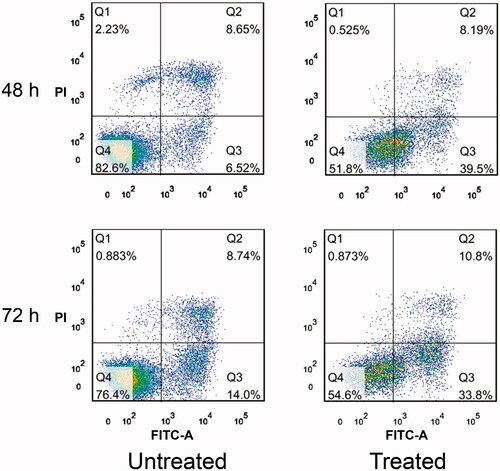
Figure 5. Mechanism of the anti-proliferative and pro-apoptotic effects on breast cancer cells. SHZ-88 cells were cultured for 12 h and then exposed to supernatants treated or not treated by perfusion through PVA-H microsphere columns. (n = 4). (a) Genes involved in positive and negative regulation from the genes involved in proliferation and apoptosis. (Left: Genes associated with positive and negative regulation of cell proliferation; Right: Genes involved in positive and negative regulation of apoptosis). (b) Functionally significantly related genes involved in the proliferative and apoptotic functions (Left: proliferation-related genes; Right: apoptosis-related genes).
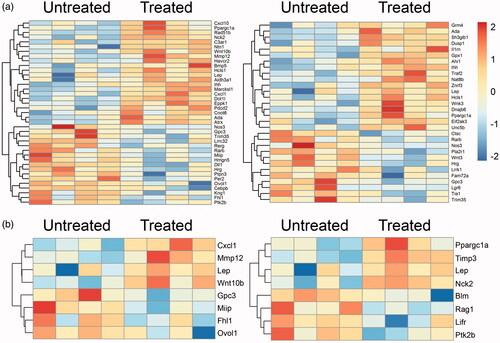
Figure 6. KEGG pathway enrichment analysis of the differentially expressed genes (Reds are up-regulated, petunias are down-regulated).
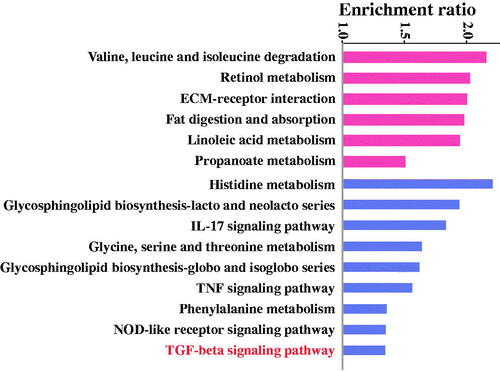
Figure 7. GO enrichment analysis of the differentially expressed genes (GO names above the imaginary line are up-regulated, GO names under the imaginary line are down-regulated).
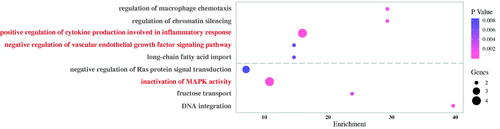
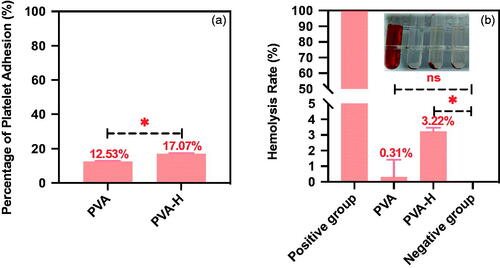
Figure 8. (a, b) Platelet adhesion and haemolysis rate of the PVA and PVA-H (inset is digital photo of the red blood cells suspensions mixed with different samples). ns: not significant, *p < .05.
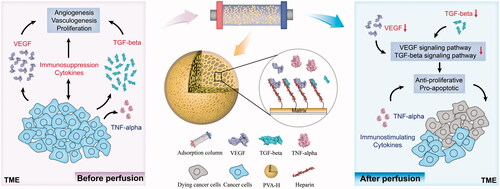
Scheme 1. Schematic illustration of targeting regulatory pathways within the TME induces apoptosis of breast cancer cells by an affinity adsorbent which can selectively deplete immunosuppressive cytokines.
Supplemental Material
Download MS Word (13.6 MB)Data availability statement
The authors confirm that the data supporting the findings of this study are available within the article and its supplementary materials.