
Figures & data
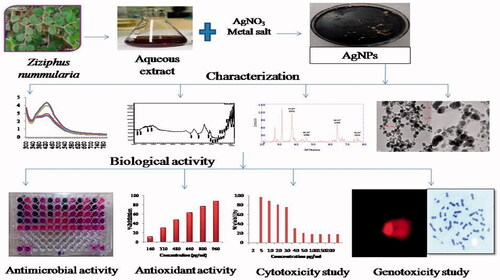
Figure 1. Ziziphus nummularia plant.
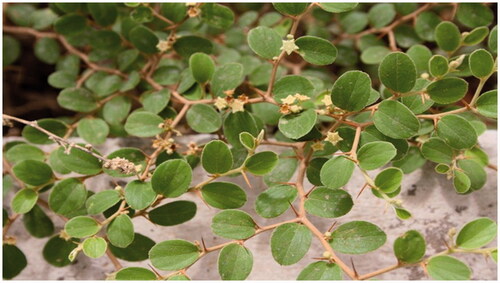
Figure 2. (A) UV-Visible spectrum of AgNPs and (B) TGA curve of AgNPs.
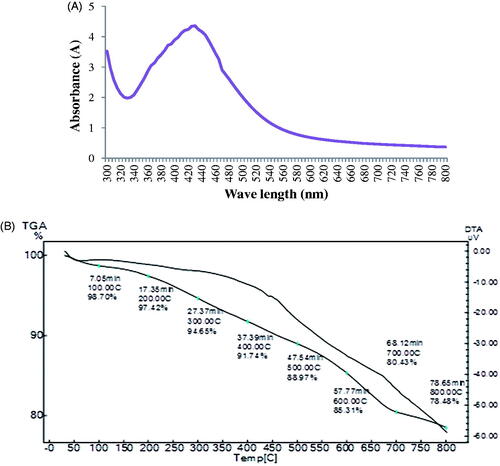
Table 1. Zeta potential of AgNPs.
Figure 5. Antimicrobial activity of AgNPs.
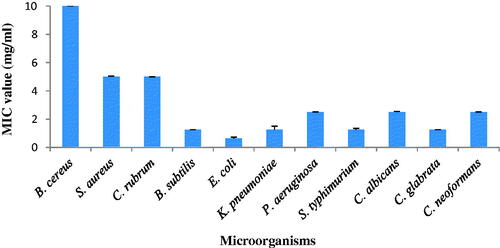
Table 2. ΣFIC index of Ag-NPs with antibiotics against bacteria and fungi.
Figure 6. Antibiofilm activity of AgNPs: (A) gram-positive bacteria, (B) gram-negative bacteria and (C) Fungi.
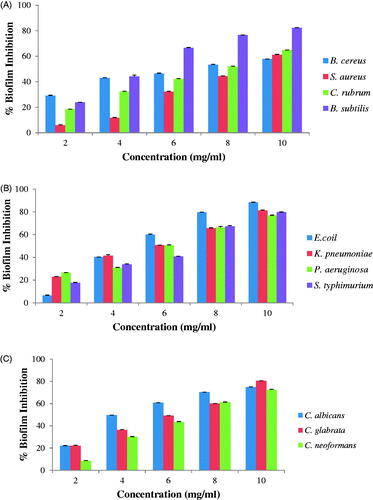
Figure 7. Antioxidant activity of AgNPs: (A) DPPH free radical scavenging activity, (B) ABTS cation radical scavenging activity, and (C) reducing capacity assessment.
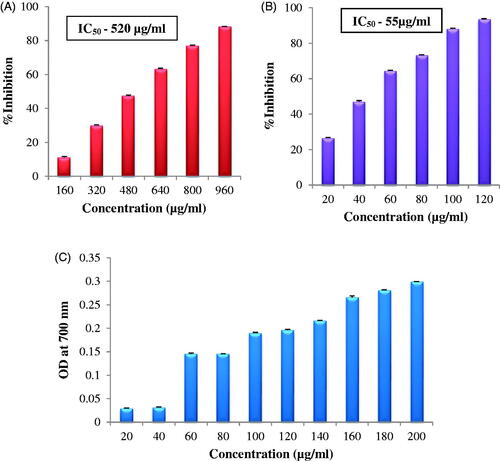
Figure 8. In vitro cytotoxicity of AgNPs.
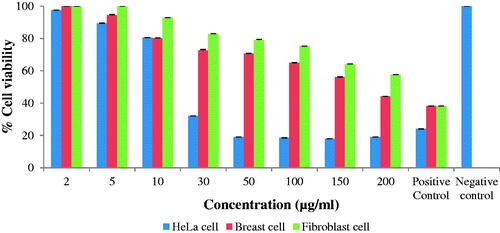
Figure 9. DNA damage in lymphocyte cells exposed to AgNPs at different concentration by alkaline comet assay(A) 2µg/ml, (B) 50µg/ml, (C) 200µg/ml, (D) Positive control (E) Negative control and (F) % tail DNA in lymphocyte cells after expose of AgNPs.
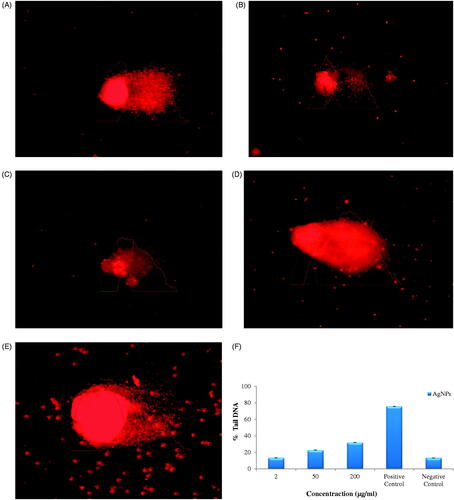
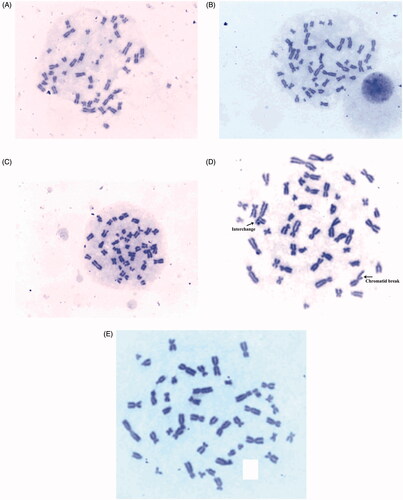
Figure 10. Chromosomal aberrations at different concentrations of AgNPs: (A) 2µg/ml, (B) 50µg/ml, (C) 200µg/ml, (D) Positive control and (E) Negative control.
Data availability statement
The authors confirm that the data supporting the findings of this study are available within the article.