
Figures & data
Table 1. Sense and anti-sense primers for quantitative real-time PCR.
Figure 1. Surface morphology of TiO2 nanotubes and identification of mesenchymal stem cells. (A) The morphology of nanotubes observed under a SEM. The diameter of the TiO2 nanotube is about 80 nm. Scale bars = 800nm (left) and 200 nm (right). (B) The morphology of pure titanium plate observed under a SEM. Scale bars = 800nm (left) and 200 nm (right). (C) The morphology of ordinary culture dish observed under a SEM. Scale bars = 800nm (left) and 200 nm (right). (D) CD29 (green) and CD90 (red) were used to determine that the cells on the surface of the nanotubes are the BMSCs which we need to cultivate. Scale bars = 100 μm.
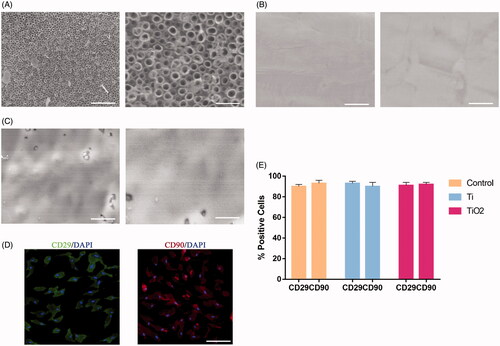
Figure 2. The effect of TiO2 nanotubes on the osteogenic differentiation of BMSCs and F-actin expression. Rat BMSCs were cultured on the surface of pure titanium and TiO2 nanotubes for 7 days. (A) The expression level of ALP in the three groups. (B) Western blot results show that TiO2 nanotubes can promote the expression of osteogenic differentiation markers (OCN, OPN, RUNX2). (C) Quantitative analysis of the results in (B). (D) The results of qRT-PCR show that TiO2 nanotubes up-regulate the gene expression levels of OCN, OPN and RUNX2. (E) Confocal laser scanning microscope observed the F-actin (red) fluorescence staining results of the three groups of BMSCs. Scale bars = 25 μm. The expression of F-actin in the TiO2 group was significantly higher than that in the pure titanium group. (F) Western blot results show that TiO2 nanotubes can up-regulate the protein level of F-actin. (G) Quantitative analysis of the results in (E). (H) Quantitative analysis of the results in (F). p < .05 (*) was considered as significant.
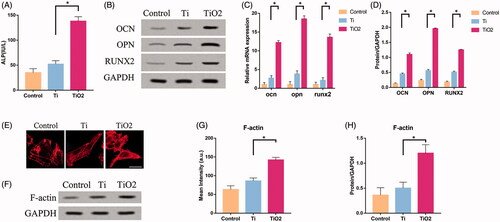
Figure 3. The role of F-actin on the osteogenic differentiation of BMSCs. Rat BMSCs were cultured on the surface of TiO2 specimens, treated with cytochalasin D and phalloidin, respectively, and cultured for 7 days. (A) ALP expression levels in the three groups. (B) Western blot results show that cytochalasin D can inhibit the expression of osteogenic differentiation markers (OCN, OPN, RUNX2), while phalloidin promotes the expression of osteogenic differentiation markers (OCN, OPN, RUNX2). (C) Confocal laser microscope observation of the F-actin (red) fluorescent staining results in three groups of BMSCs. Cytochalasin D can inhibit F-actin polymerization, while phalloidin promotes F-actin polymerization. Scale bars = 25 μm. (D) Western blot results show that cytochalasin D can down-regulate the expression of F-actin, GCN5, H3K9AC, and phalloidin can up-regulate the expression of F-actin, GCN5, H3K9AC. (E) Quantitative analysis of the results in 3(C). (F) The results of qRT-PCR show that TiO2 nanotubes up-regulate the gene expression levels of OCN, OPN and RUNX2. (G) Quantitative analysis of the results in (D). p <. 05 (*) was considered as significant (compared to TiO2 in each group).
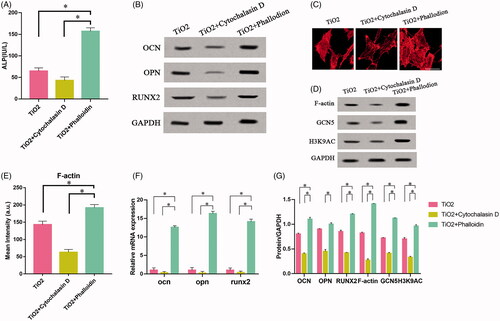
Figure 4. The effect of TiO2 nanotubes on the continuous expression of HAT family and F-actin. Rat BMSCs were cultured on the surface of TiO2 specimens for 7 days. The expressions of F-actin and HAT family in BMSCs were detected on the 0th, 3rd, and 7th days respectively. (A) Western blot results showed that only the expression of GCN5 continued to increase, Consistent with the changes in the expression level of F-actin. (B) Confocal laser microscopy observed the F-actin (red) fluorescence staining results on the 0th, 3rd, and 7th day. Scale bars = 25 μm. The expression level of F-actin increased with the increase of culture time. (C) The results of qRT-PCR show that TiO2 nanotubes stably up-regulate the gene expression level of GCN5. (D) Quantitative analysis of the results in (A). p < .05 (*) was considered as significant (compared to 0d in each group). (E) Quantitative analysis of the results in (B).
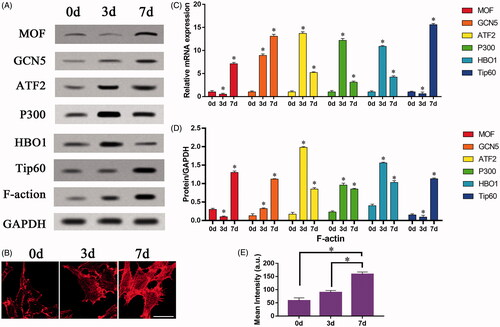
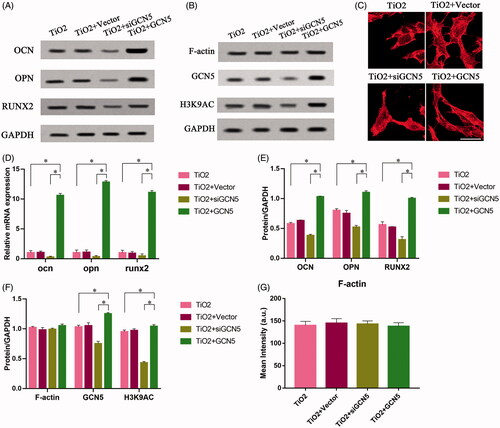
Figure 5. The effect of F-actin on the osteogenic differentiation of mesenchymal stem cells regulated by GCN5. BMSCs infected with lentiviral vectors were cultured on the surface of TiO2 nanotubes for 7 days, and BMSCs that inhibited GCN5 expression (TiO2 + siGCN5) and overexpressed GCN5 (TiO2 + GCN5) were constructed. (A) Western blot results showed that the expression levels of GCN5 and osteogenic differentiation markers (OCN, OPN and RUNX2) in the TiO2 + siGCN5 group decreased and in the TiO2 + GCN5 group increased. (B) Western blot results verified the intervention effect of siGCN5 and GCN5 overexpression and also showed that F-actin is not regulated by GCN5. (C) Confocal laser microscope observation of the F-actin (red) fluorescent staining results on 7 day show that F-actin is not regulated by GCN5. Scale bars = 25 μm. (D) The results of qRT-PCR showed that the gene levels of GCN5 and osteogenic differentiation markers (OCN, OPN and RUNX2) in the TiO2 + siGCN5 group decreased, and in the TiO2 + GCN5 group increased. (E) Quantitative analysis of the results in (A). (F) Quantitative analysis of the results in (B). (G) Quantitative analysis of the results in (C). p < .05 (*) was considered as significant.
Supplemental Material
Download TIFF Image (4.3 MB)Supplemental Material
Download MS Word (12.9 KB)Data availability statement
The datasets used and/or analysed during the current study are available from the corresponding author on reasonable request.