
Figures & data
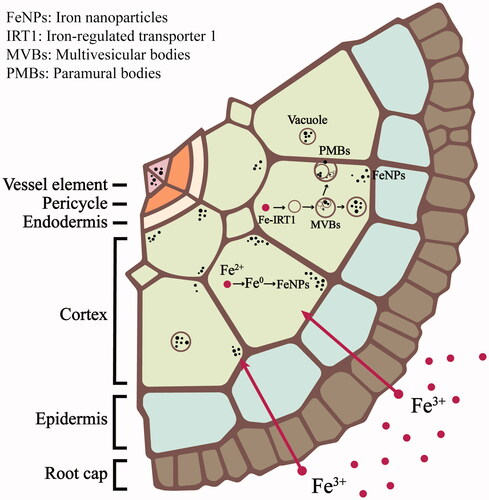
Figure 1. Toxicity effects of Fe(NO3)3 and Ni(NO3)2 in A. pinnata: (A) effects of various concentrations of each metal and (B) effects of single and dual treatments of both metals at 50 mM.
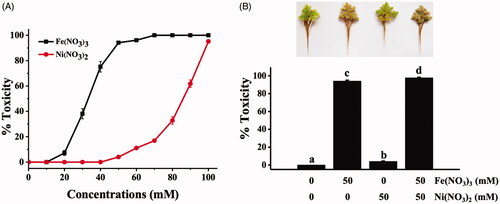
Figure 2. EDXRF mapping images of 26Fe, 28Ni, 16S, 17Cl, 19K, and 20Ca in A. pinnata exposed to Fe(NO3)3 and Ni(NO3)2.
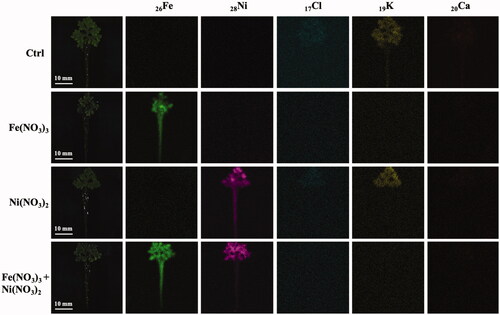
Figure 3. Elemental quantitative analysis of A. pinnata exposed to Fe(NO3)3 and Ni(NO3)2 in (A) roots and (B) shoots.
Figure 4. ATR-FTIR spectra of A. pinnata exposed to Fe(NO3)3 and Ni(NO3)2 in the wavelength range of 4000−400 cm−1.
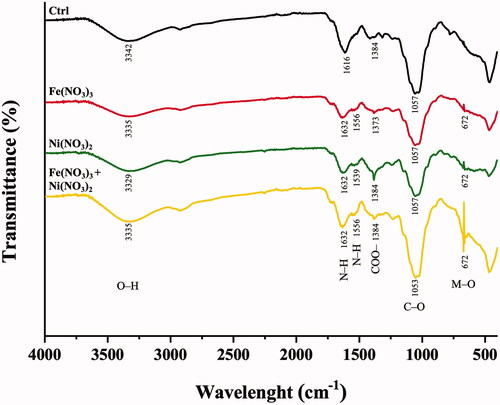
Figure 5. TEM images of cortical cells of A. pinnata roots: (A) control, (B) Fe(NO3)3 treatment, (C) Ni(NO3)2 treatment, and (D,E) both metal treatments. Abbreviations: c: cortical cell; v: vacuole; mvbs: multivesicular bodies. Arrows and arrow heads indicated nanoparticles and plasmolysis, respectively.
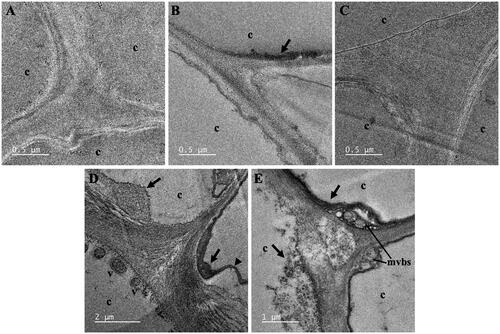
Figure 6. TEM images of vascular cells of A. pinnata roots: (A,B) Fe(NO3)3 treatment, and (C,D) Fe(NO3)3 and Ni(NO3)2 treatments. Abbreviations: mx: metaxylem; p: pericycle; ph: phloem; pmb: paramural body. Arrows and arrow heads indicated nanoparticles and plasmolysis, respectively.
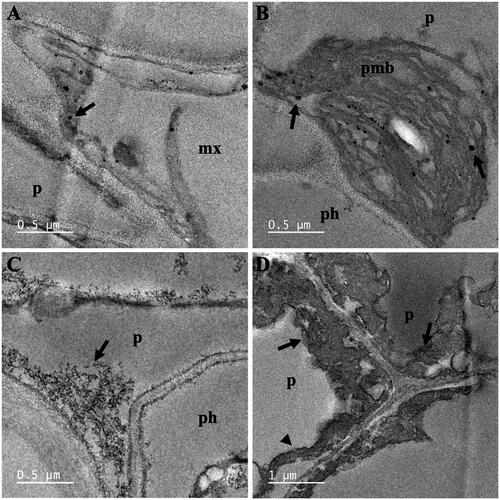
Figure 7. SAED-TEM analysis of cellular NPs in A. pinnata treated with (A) Fe(NO3)3 and (B) Fe(NO3)3 and Ni(NO3)2.
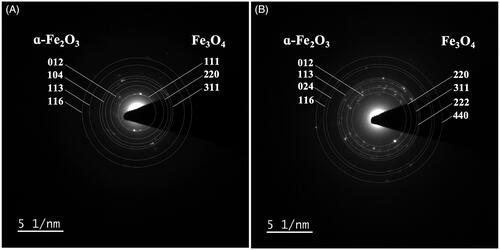
Figure 8. EDX-SEM analyses in roots and leaves of A. pinnata: (A) control, (B) Fe(NO3)3 treatment, (C) Ni(NO3)2 treatment, and (D) both metal treatments.
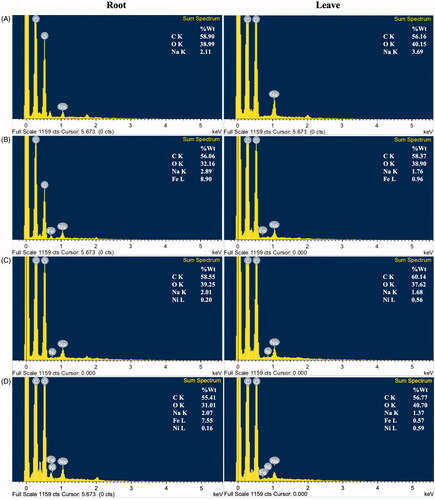
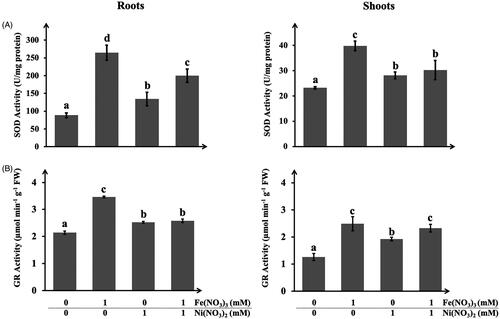
Figure 9. Activities of (A) superoxide dismutase and (B) glutathione reductase in roots and shoots of A. pinnata exposed to Fe(NO3)3 and Ni(NO3)2.
Data availability statement
The authors confirm that the data supporting the findings of this study are available within the article [and/or] its supplementary materials.