
Figures & data
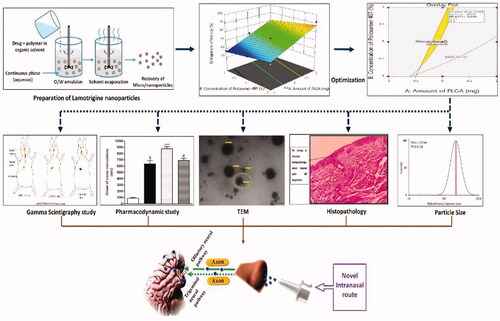
Table 1. Optimized formulation parameters for LTG-PNPs.
Figure 1. In-vitro release profiles of LTG-SOL & LTG-PNPs.
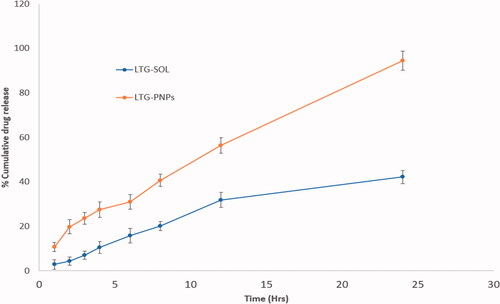
Figure 2. DSC Thermogram of (A) Pure LTG (B) LTG-PNPs.
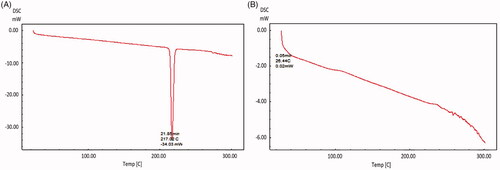
Figure 3. X-ray diffractogram of (A) pure LTG (B) PLGA (C) Poloxamer 407 (D) LTG-PNPs.
Figure 4. TEM image of LTG-PNPs.
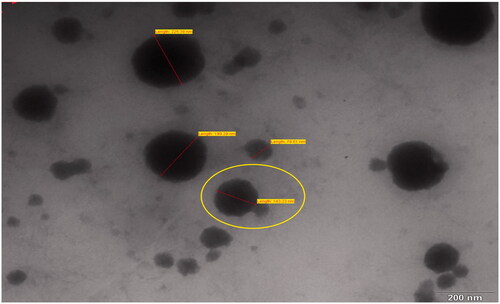
Figure 5. FTIR spectra of (A) Pure LTG (B) LTG-PNPs.
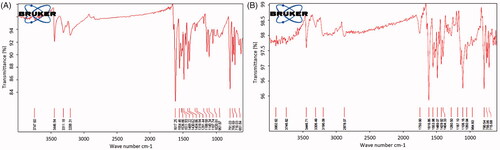
Figure 6. Ex-vivo permeation of LTG-SOL & LTG-PNPs across goat nasal mucosa.
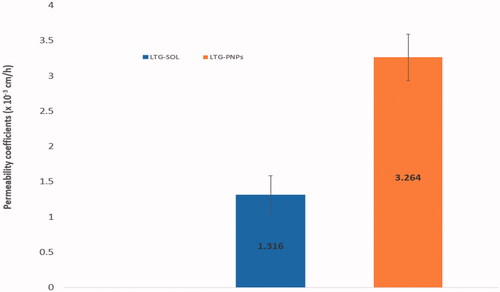
Figure 7. Histopathological condition of goat nasal mucosa after treatment with (A) Phosphate buffer saline (PBS) pH 6.4 (B) Isopropyl alcohol (IPA) (C) LTG-SOL (D) LTG-PNPs.
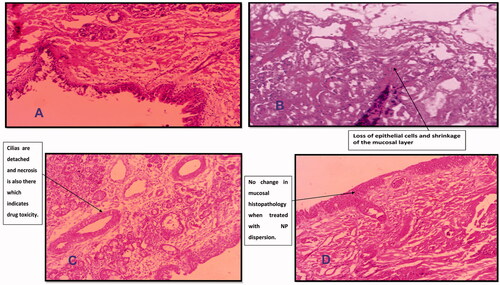
Figure 8. Drug concentration versus time plot upon administration of 99mTc-LTG-SOL (intranasal and intravenous). and 99mTc-LTG-PNPs (intranasal) in BALB/c mice in (A) blood (B) brain.
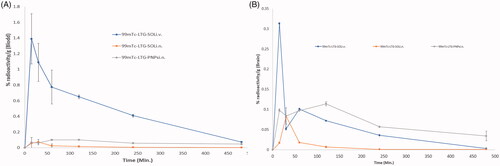
Table 2. Biodistribution of 99mTc-LTG-SOLi.v., 99mTc-LTG-SOLi.n., 99mTc-LTG-PNPsi.n. in blood and brain at different time intervals in BALB/c Mice*.
Table 3. Pharmacokinetic Parameters of 99mTc-LTG-SOLi.v., 99mTc-LTG-SOLi.n. and 99mTc-LTG-PNPi.n. in BALB/c Mice.
Table 4. Drug targeting efficiency [DTE (%)] and direct target organ transport [DTI (%)] following administration of 99mTc-LTG-SOLi.n. and 99mTc-LTG-PNPsi.n.
Figure 9. Gamma scintigraphy images in rabbits following intranasal administration of (A) 99mTc-LTG-SOL. and (B) 99mTc-LTG-PNPs.
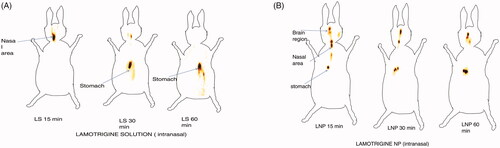
Figure 10. Onset time of seizures in Pentylenetetrazole (PTZ)-induced convulsions in Albino Wistar rats.
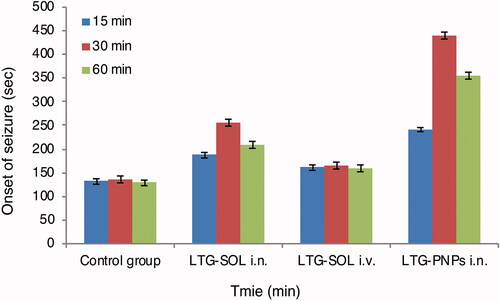
Table 5. Time (s) for the development of seizures in male Albino Wistar rats (n = 6).
Table 6. Stability study of LTG-PNPs (P10).