Figures & data
Figure 1. Effects of different explants with different plant growth regulators on callus induction frequency. Data represent the mean values of triplicates with ± standard error for each treatment in three repeated experiments. Annotation of columns data with different alphabet (s) represents the significance at (p = .05).
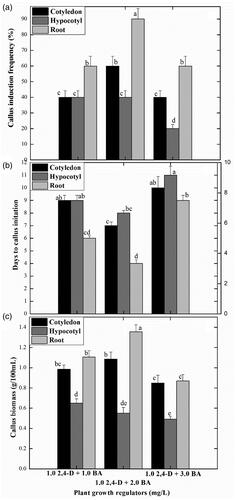
Figure 2. Effects of different levels of Zinc oxide nanoparticles and light regimes on callus biomass formation. Data represent the mean values of triplicates with ± standard error for each treatment in three repeated experiments. Annotation of columns data with different alphabet (s) represents the significance at (p = .05).
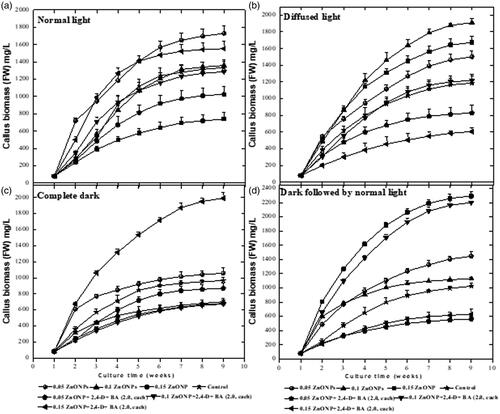
Figure 3. Interactive effects of ZnO NPs alone or in combination with PGRs under different light regimes on callus biomass formation in S. marianum. A1–A7= Normal light. A1: 0.05 mg/L ZnO NPs, A2: 0.1 mg/L ZnO NPs, A3: 0.15 mg/L ZnO NPs, A4: 2 mg/L BA + 2 mg/L 2,4-D, A5: 0.05 mg/L ZnO NPs+ 2 mg/L BA + 2 mg/L 2,4-D, A6: 0.1 mg/L ZnO NPs+ 2 mg/L BA + 2 mg/L 2,4-D, A5: 0.15 mg/L ZnO NPs+ 2 mg/L BA + 2 mg/L 2,4-D. A8-A14= Diffuse light. A8: 0.05 mg/L ZnO NPs, A9: 0.1 mg/L ZnO NPs, A10: 0.15 mg/L ZnO NPs, A11: 2 mg/L BA + 2 mg/L 2,4-D, A12: 0.05 mg/L ZnO NPs+ 2 mg/L BA + 2 mg/L 2,4-D, A13: 0.1 mg/L ZnO NPs+ 2 mg/L BA + 2 mg/L 2,4-D, A14: 0.15 mg/L ZnO NPs+ 2 mg/L BA + 2 mg/L 2,4-D. A15-A21= Complete dark. A15: 0.05 mg/L ZnO NPs, A16: 0.1 mg/L ZnO NPs, A17: 0.15 mg/L ZnO NPs, A18: 2 mg/L BA + 2 mg/L 2,4-D, A19: 0.05 mg/L ZnO NPs+ 2 mg/L BA + 2 mg/L 2,4-D, A20: 0.1 mg/L ZnO NPs+ 2 mg/L BA + 2 mg/L 2,4-D, A21: 0.15 mg/L ZnO NPs+ 2 mg/L BA + 2 mg/L 2,4-D. A22-A28= Complete dark followed by normal light. A22: 0.05 mg/L ZnO NPs, A23: 0.1 mg/L ZnO NPs, A24: 0.15 mg/L ZnO NPs, A25: 2 mg/L BA + 2 mg/L 2,4-D, A26: 0.05 mg/L ZnO NPs+ 2 mg/L BA + 2 mg/L 2,4-D, A27: 0.1 mg/L ZnO NPs+ 2 mg/L BA + 2 mg/L 2,4-D, A28: 0.15 mg/L ZnO NPs+ 2 mg/L BA + 2 mg/L 2,4-D.
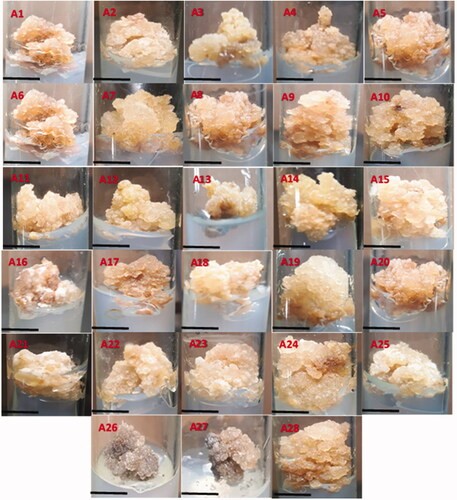
Table 1. Interactive effect of ZnO NPs and light treatments on callus morphology of S. marianum.
Figure 4. Effects of different levels of Zinc oxide nanoparticles and light regimes on secondary metabolites production in callus cultures. Data represent the mean values of triplicates with ± standard error for each treatment in three repeated experiments. Annotation of columns data with different alphabet (s) represents the significance at (p = .05).
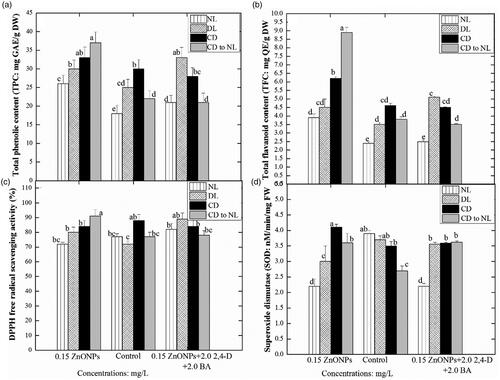
Figure 5. Effects of different levels of Zinc oxide nanoparticles and light regimes on the production of pal activity and silymarin content in callus cultures. Data represent the mean values of triplicates with ± standard error for each treatment in three repeated experiments. Annotation of columns data with different alphabet (s) represents the significance at (p = .05).
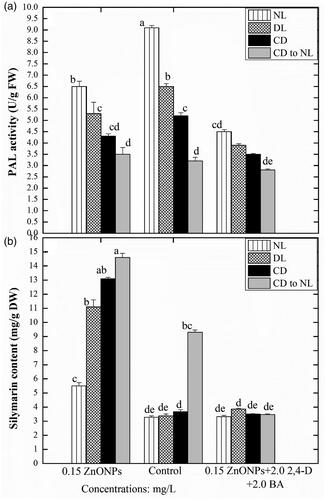
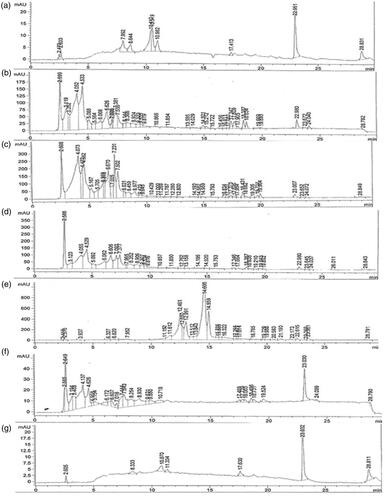
Figure 6. HPLC chromatograms of the selected plant samples. (a): standard silymarin, (b): Callus raised in vitro at 0.15 mg/L ZNO NPs under complete dark for two weeks’ period followed by transference to normal light, (c): Callus raised in vitro at 0.5 mg/L ZNO NPs under complete dark, (d): Callus raised in vitro at 0.5 mg/L ZNO NPs under diffused light, (e): Callus raised in vitro at 0.5 mg/L ZNO NPs under normal light, (f): Control treatment under complete dark for two weeks’ period followed by transference to normal light, (g): Callus raised in vitro at 0.15 mg/L ZNO NPs + 2 mg/L BA + 2 mg/L BA under diffused light.