Figures & data
Table 1. Characteristics of the study cohort at baseline.
Figure 1. Distribution of HDL subclasses between groups. Level of HDL2b-c (%) (A), HDL3-c (%) (B), HDL2b-c (mmol/L) (C) and HDL3-c (mmol/L) (D) in the four groups. The bar height indicates the proportion of each HDL subclasses expressed as a percentage relative to total HDL-protein as determined by absorbance ± standard error. *p < .05, **p < .01 by one-way ANOVA.
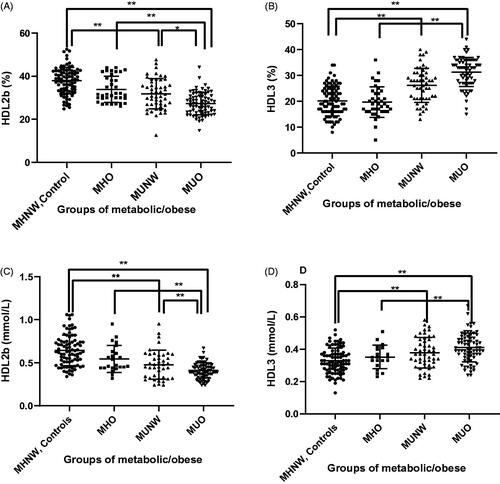
Figure 2. Alteration of HDL related proteins between groups. Level of apoA-1 (mg/dL) (A), RBP (mg/L) (B), PON-1 (ng/ml) (C) in the four groups. The bar height indicates the proportion of each protein expressed as a percentage relative to total value as determined by absorbance ± standard error. *p < .05, **p < .01 by one-way ANOVA.
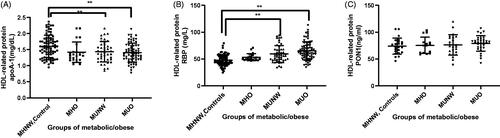
Figure 3. Inflammatory cells counts and inflammation factors in the four groups. White blood cells count (A), neutrophils count (B), monocyte count (C) and lymphocytes count (D) in controls, MHO, MUNW and MUO. The levels of IL-6 (D) and hs-CRP (E) in controls, MHO, MUNW and MUO. *p < .05, **p < .01 by one-way ANOVA.
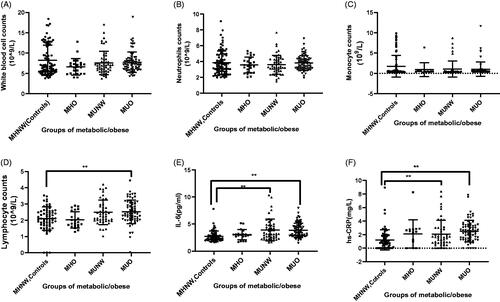
Table 2. Correlations between HDL subclasses and metabolic factors and inflammatory indexes.
Table 3. Stepwise linear regression models.
Table 4. Multivariable linear regression analysis of HDL subclasses and inflammatory indexes.
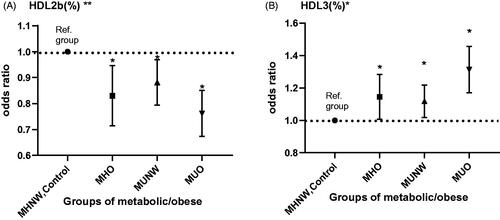
Figure 4. The result of multinomial logistic regression analysis. Significant results of multinomial logistic regression analysis to assess the association between HDL subclasses and metabolic syndrome/obesity adjusted by sex, age, moderate physical activity, and quitting smoking. *p < .05. **p < .01. Metabolically healthy normal weight (MHNW) was set as the reference group.