Figures & data
Table 1. Primer sequence for RT-PCR analysis.
Table 2. Optimization of different lipid mass ratio.
Figure 1. (a) Schematic presentation of preparation of TRI and ATRA-loaded lipid-polymer hybrid nanoparticles; (b) particle size distribution of ATLP; (c) zeta potential of ATLP; (d) morphology analysis of ATLP.
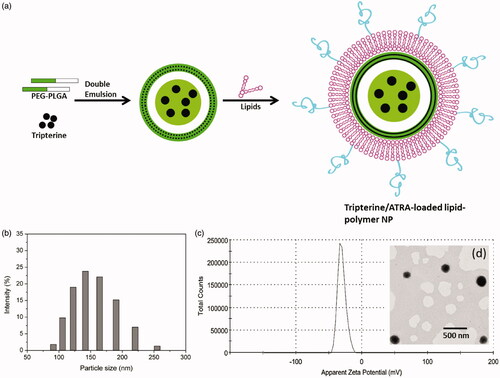
Figure 2. In vitro release of (a) TRI and (b) ATRA from ATLP in buffers maintained in different pH conditions, pH 7.4, pH 6.5 and pH 5.0. The release study was performed in 37 °C for 72 h.
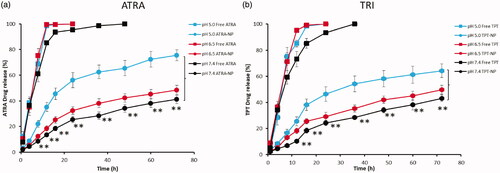
Figure 3. (a) Flow cytometric analysis of cellular uptake of ATLP in Caco-2 cells in time-dependent manner; (b) confocal laser scanning microscopy (CLSM) analysis of uptake of nanoparticles in the Caco-2 cells after 2 h of incubation.
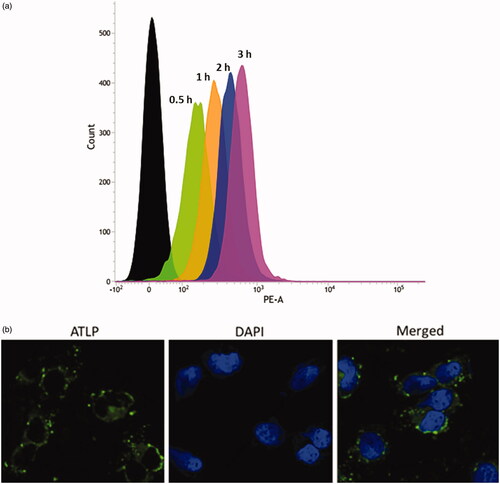
Figure 4. (a–c) Effect of TRI, ATRA and ATLP on the expression levels of pro-inflammatory cytokines in LPS-stimulated RAW264.7 cells. The mRNA expression of TNF-α, IL-6 and IL-1β was evaluated by RT-PCR technique.
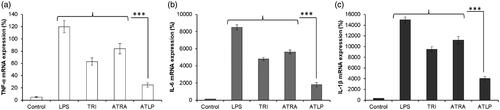
Figure 5. In vivo anti-arthritic efficacy of TRI, ATRA and ATLP in terms of hind paw thickness. The formulations were administered 3 days after the onset of CIA and injected via tail for totally 7 times with a gap of 3 days once.
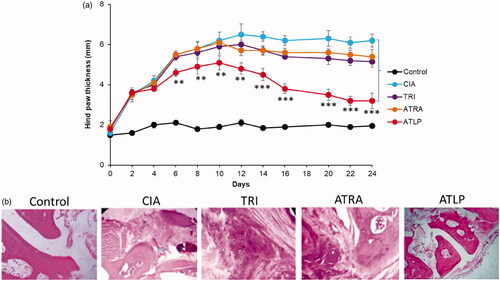
Figure 6. In vivo anti-arthritic efficacy of TRI, ATRA and ATLP in terms of (a) arthritic score, (b) body weight. The formulations were administered 3 days after the onset of CIA and injected via tail for totally 7 times with a gap of 3 days once.
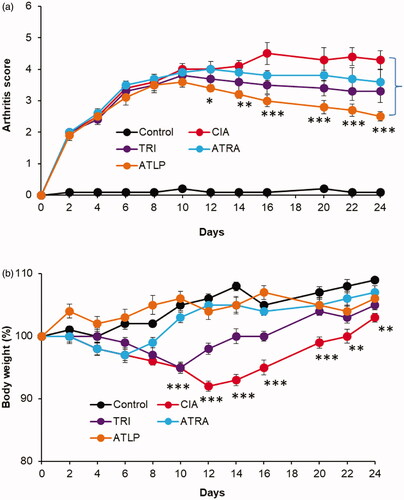
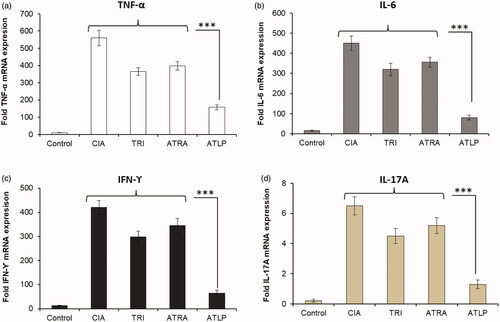
Figure 7. Effect of different formulations on the expression of inflammatory cytokines in the CIA mice. RT-PCR analysis of expression of mRNA levels of TNF-α, IL-6, IFN-ϒ and IL-17 from right hind paw tissue.