
Figures & data
Table 1. Hormonal and weight changes in experimental groups.
Table 2. Morphometry of the seminiferous tubule – diameter, area, membrane thickness and cell count.
Figure 1. (a) Sperm count, (1b) sperm motility and (c) sperm morphology among the groups. This figure describes the testicular morphology and morphometric parameters across all the treatment groups and control. (A) Sperm count, (B) Sperm motility and (C) sperm morphology.
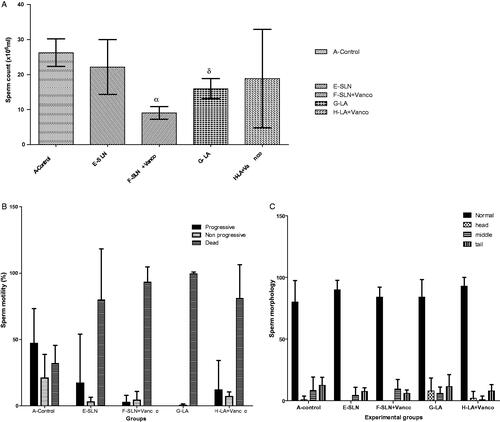
Figure 2. These photomicrographs depict the testicular sections of control and treated rats. The section of control shows well-preserved cytoarchitecture with normal cellular composition in the seminiferous germinal epithelium (GE). The interstitial (I) spaces filled with Leydig cells were normal. The lumen (L) is also populated by immotile spermatozoa (A). Notice thickened basement membrane (BM) with hypoplastic ST with loss of germ cells and hypocellular interstitium in other groups (H&E).
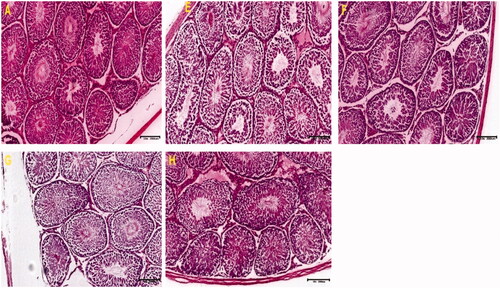
Figure 3. Photomicrograph of testicular sections stained with Masson’s Trichrome for connective tissue. Note the extensive, intense staining of seminiferous tubular Basement membrane and interstitial spaces alongside hypoplasia in sections E, F and H compared with control (A). Nuclei can be seen as dark red or black structures within the tubular cell population, while fibrous elements are stained light blue.
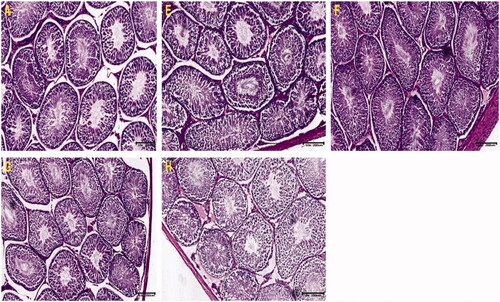
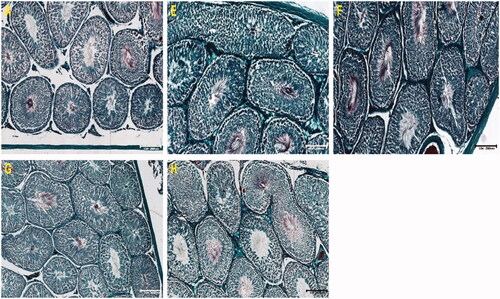
Figure 4. Photomicrographs of testicular sections stained with PAS. Note the intense pink colour and PAS-intensity of tubular cells in groups E, F and G. Control sections showed well stained and preserved architectural layout with preserved seminiferous tubular integrity. Evidence of hypoplasia with poor PAS staining in some tubules (G & H).
Data availability statement
All data are included in the submission/manuscript file.