
Figures & data
Figure 1. (A) Argyreia nervosa plant. (B): (a) Plant extract of A. nervosa; (b) Green synthesised An-AgNPs by Plant extract of A. nervosa. (C) UV-VIS absorption spectra of An-AgNPs synthesised from A. nervosa plant extract with 0.02 M silver nitrate.
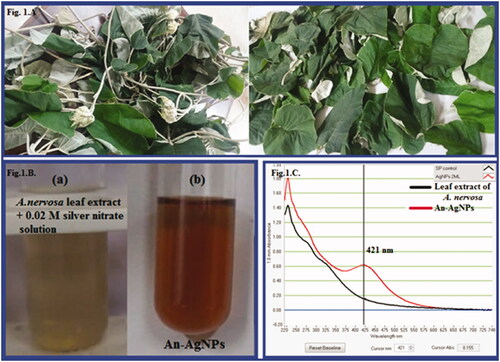
Figure 2. (A) FTIR spectrum of the A. nervosa leaf extract. (B) FTIR spectrum of the green synthesised An-AgNPs.
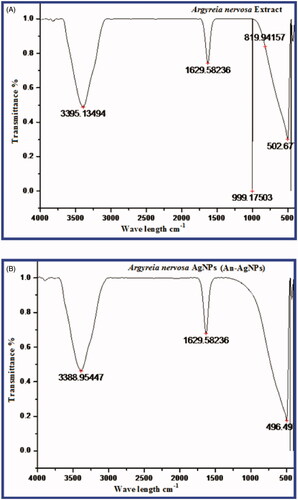
Figure 3. (A) Particle size distribution curve of green synthesised An-AgNPs. (B) Zeta potential of green synthesised An-AgNPs.
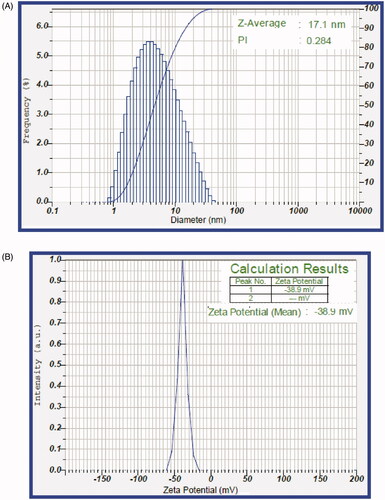
Figure 4. (A) TEM images of green synthesised An-AgNPs at different magnification (a) 200 Kx (b)100 Kx (c) 50Kx (d) 50Kx (e)20 Kx and (f) SAED pattern showed four diffraction rings. (B) EDX analysis of green synthesised An-AgNPs.
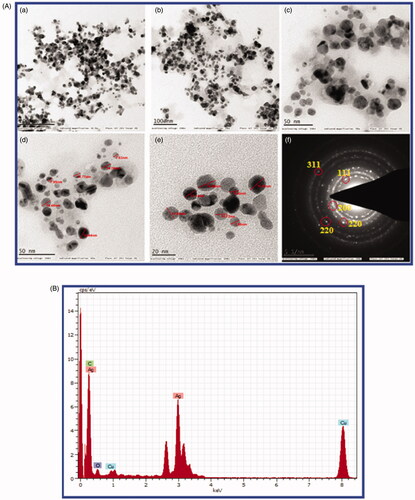
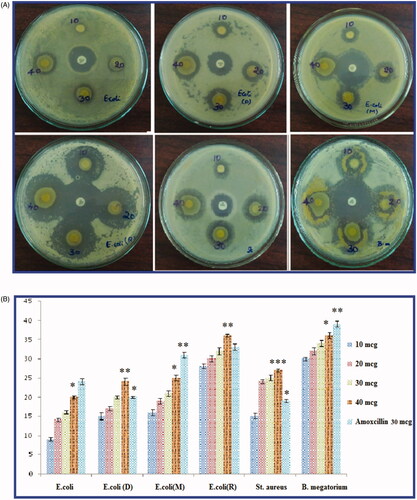
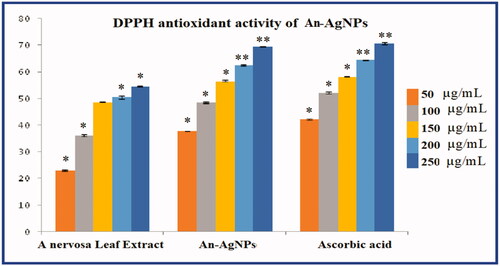
Table 1. Antimicrobial activity of An-AgNPs.
Table 2. DPPH antioxidant activity An-AgNPs.
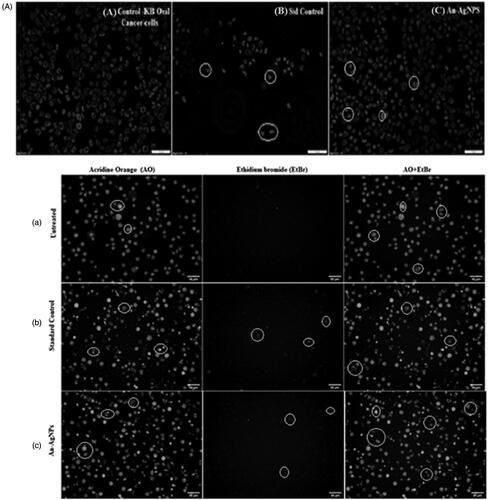
Figure 6. (A) MTT assay of cytotoxic studies of green synthesised An-AgNPs on KB-human oral carcinoma cell line and its morphological changes of KB cells observed under an inverted light microscope. (a) Untreated KB cell line, (b) KB cell line cells treated with 25 µg of An-AgNPs, (c) KB-cell line treated with 50 µg of An-AgNPs, (d) KB cell lines treated with 100 µg of An-AgNPs, (e) KB cell lines treated with 200 µg of An-AgNPs, and (f) Standard control(Camptothecin 7.5 uM). (B and C) Comparative percentage of Cell viability studies of green synthesised An-AgNPs on KB-human oral carcinoma cell line by MTT assay and the IC50 value is calculated to be = 58.64 µl/mL.
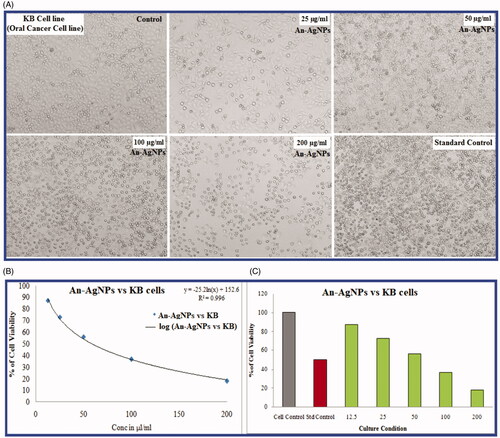
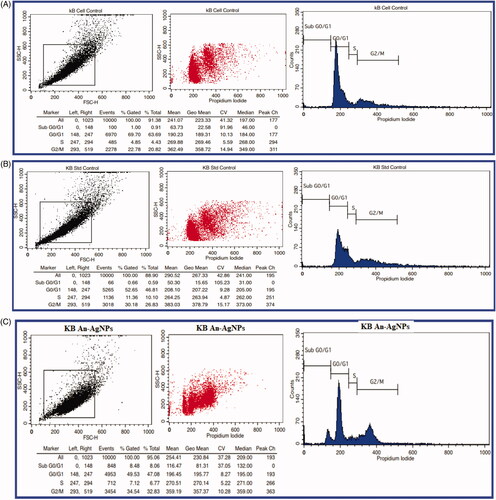
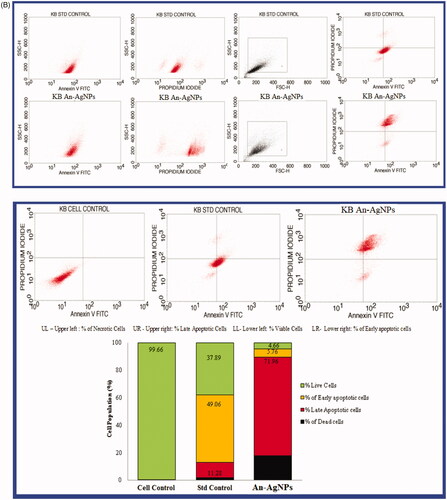
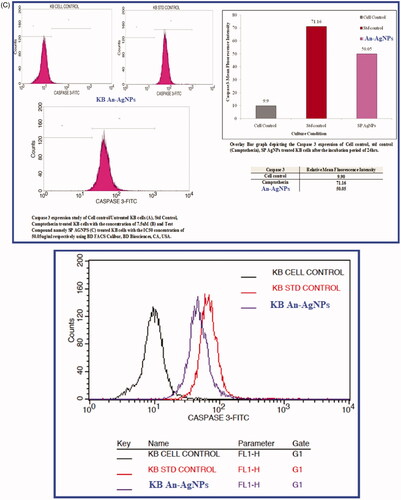
Figure 7. (A,B,C) Cycle cell assay of green synthesised An AgNPs on KB-human oral carcinoma cell line.
Data availability statement
All the data related to our research article is present in the manuscript submitted