
Figures & data
Figure 1. Schematic of the experimental design to evaluate the immunosuppressive effect, internalization, and release mechanism of Sq-GusNPs in vitro.
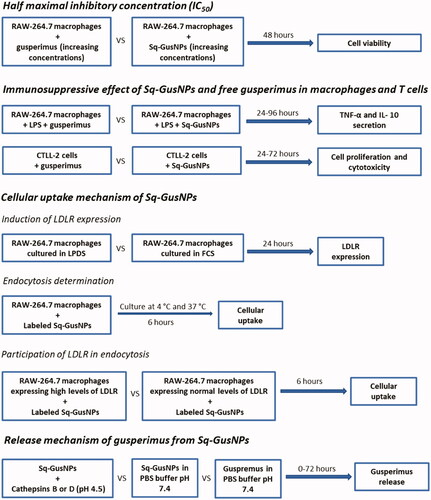
Figure 2. Scheme of the synthesis process of Sq-Gus bioconjugate. NBS: N-bromosuccinimide; THF: tetrahydrofuran; NHS: N-hydroxysuccinimide; DCC: N,N′-dicyclohexylcarbodiimide; DCM: dichloromethane; Gus: gusperimus; DMF: dimethylformamide.
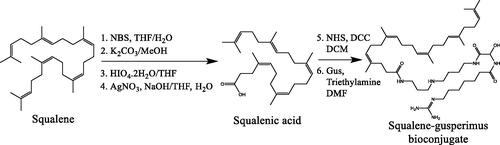
Table 1. Primer sequences used for qRT-PCR.
Figure 3. Proliferation dose-response curves for Sq-GusNPs (blue) and free gusperimus (red) in mouse macrophages. A 9-fold lower IC50 value was observed for gusperimus when it was encapsulated as Sq-GusNPs compared with the free drug. Data represent mean values ± SEM of five experiments.
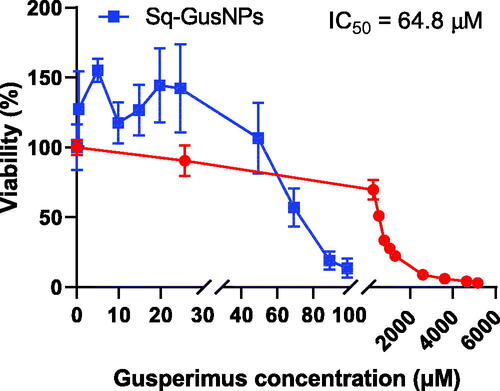
Figure 4. Immunosuppressive effect of Sq-GusNPs and free gusperimus in macrophages and T cells. (A) TNF-α and (B) IL-10 secretion after stimulation of mouse macrophages with LPS and exposure to free or encapsulated gusperimus over time. The anti-inflammatory effect was maintained over time and was higher for cells treated with Sq-GusNPs. (C) Cell proliferation and (D) cytotoxicity of Sq-GusNPs and free gusperimus in mouse cytotoxic T lymphocytes. Sq-GusNPs inhibited cell proliferation without cytotoxic effects. Comparisons were made using two-way ANOVA with Tukey's multiple comparisons test. Macrophages: RAW—234.7 without treatment; T cells: CTLL-2 cells without treatment; LPS: macrophages or T cells stimulated with LPS; Gus: Macrophages or T cells treated with free gusperimus and stimulated with LPS; Sq-GusNPs: Macrophages or T cells treated with Sq-GusNPs and stimulated with LPS. Data represent mean values ± SEM of three experiments. ****p ≤ .0001; ***p < .0005; **p < .008; *p < .05; ns: non-significant difference.
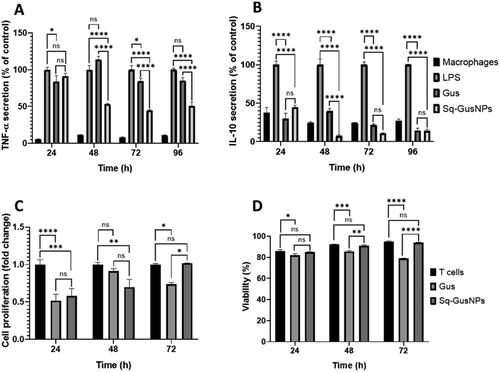
Figure 5. Uptake of Nile red labelled Sq-GusNPs by mouse macrophages. (A) Uptake of Nile red labelled Sq-GusNPs by macrophages cultured in complete medium at 37 and 4 °C. The lower uptake at 4 °C demonstrates that the internalization of the nanoparticles was mainly performed via an energy-dependent mechanism. (B–D) Are gene sequences associated with variants 1, 2, and 3 of the LDLR gene, respectively. In all cases, a higher expression of LDLR was observed after culturing the macrophages with LPDS for 24 h. (E) Uptake of Nile red labelled Sq-GusNPs by macrophages expressing normal and higher levels of LDLR. A 3-fold increase in Sq-GusNPs uptake was observed after inducing the expression of LDLRs in macrophages confirming the participation of LDLR in the internalization of Sq-GusNPs. Complete medium: macrophages incubated in culture medium supplemented with 10% FBS; LPDS medium: macrophages incubated in culture medium supplemented with 10% of LPDS instead of FBS. Comparisons were made using a two-tailed, unpaired t-test. Data represent mean values ± SEM of five experiments. ****p < .0001; ***p = .0006; **p = .0015; *p = .0110.
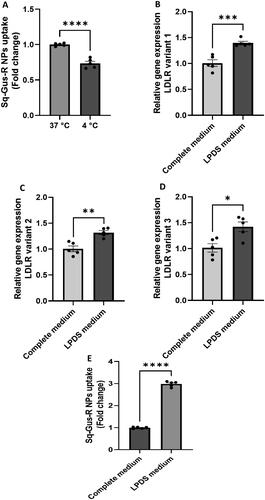
Figure 6. Release profile for free gusperimus (red) and Sq-GusNPs (blue) in PBS at pH 7.4, and for Sq-GusNPs in presence of cathepsins B (green) or D (black) at pH 4.8. After exposing Sq-GusNPs to cathepsins in acidic conditions gusperimus is released to a higher extend confirming that the Sq-GusNPs acts as a prodrug and release gusperimus intracellularly after being cleavage by proteases.
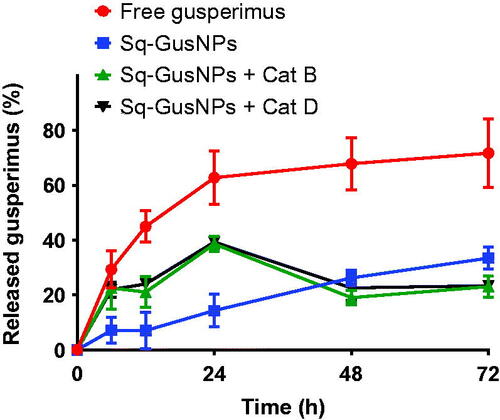
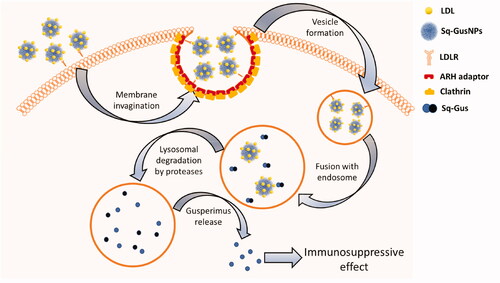
Figure 7. Gusperimus release mechanism from Sq-GusNPs after internalization. LDL: low-density lipoproteins; Sq-GusNPs: squalene-gusperimus nanoparticles; LDLR: low-density lipoprotein receptor; ARH adaptor: autosomal recessive hypercholesterolaemia adaptor protein; Clathrin: clathrin protein; Sq-Gus: squalene-gusperimus bioconjugate.
Data availability statement
Data supporting the findings of this study are available within the article and from the corresponding author upon reasonable request.