
Figures & data
Figure 1. Molecular structure of gemifloxacin.
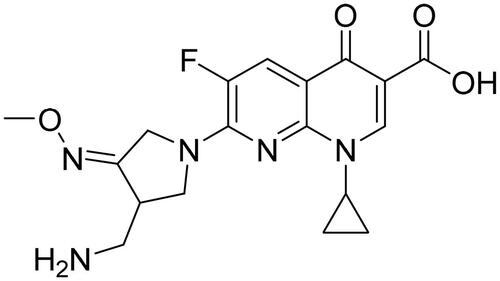
Figure 2. UV–Vis spectra of AgNO3, Gemi-AgNPs, and gemifloxacin.
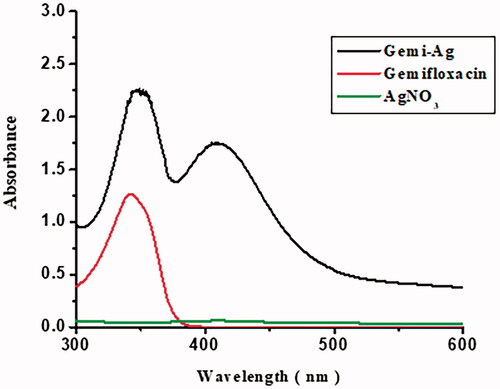
Figure 3. Reaction optimization of Gemi-AgNPs.
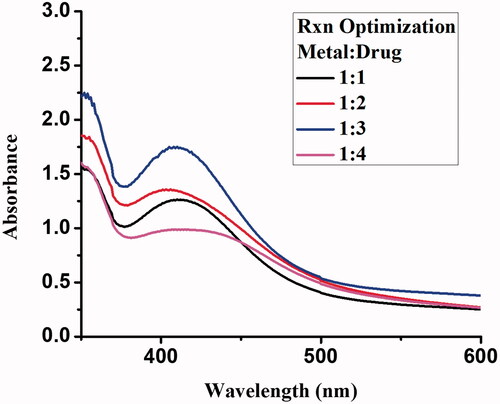
Figure 4. Effect of different pH values (2–13) on the stability of Gemi-AgNPs.
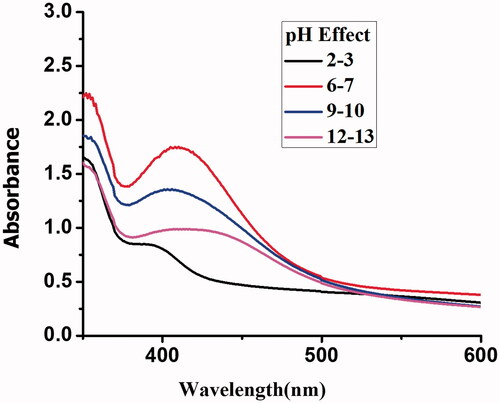
Figure 5. Stability of Gemi-AgNPs at different ranges of temperature.
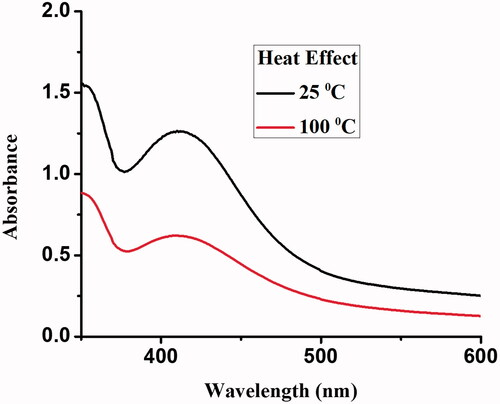
Figure 6. FTIR spectra of gemifloxacin and Gemi-AgNPs.
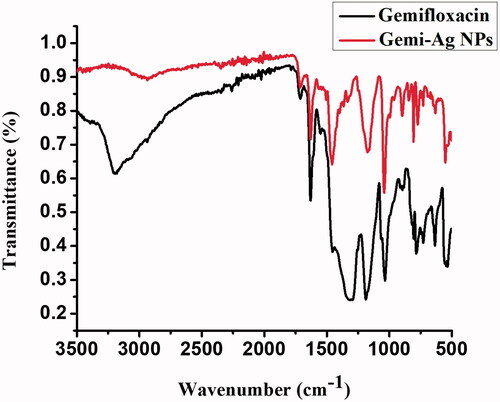
Figure 7. Mechanism of the interaction between AgNPs and Gemifloxacin.
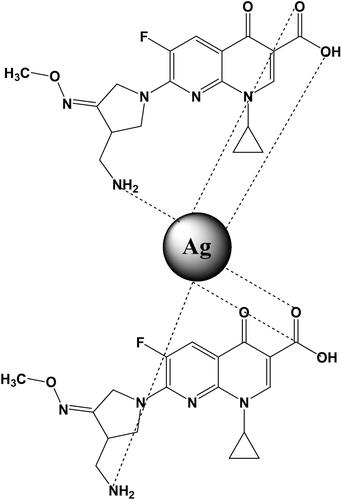
Table 1. FTIR spectral assignment of free gemifloxacin and Gemi-AgNPs.
Figure 8. Particle-size distribution of Gemi-AgNPs using AFM.
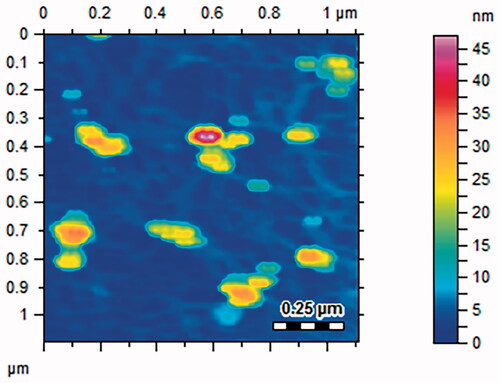
Figure 9. TEM images showing round-shaped Gemi-AgNPs.
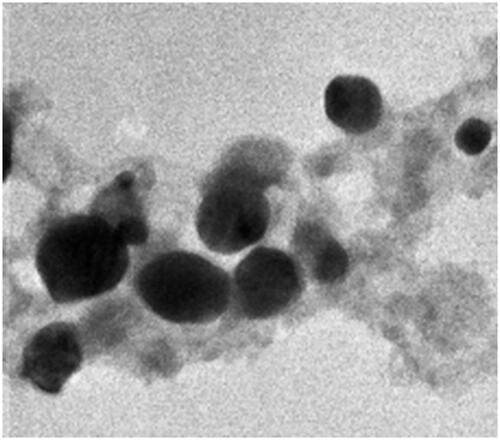
Figure 10. Particle-size distribution of Gemi-AgNPs.
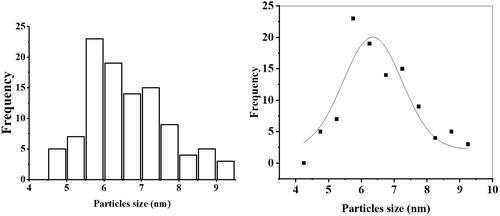
Table 2. Biofilm inhibition of gemifloxacin and Gemi-AgNPs.
Figure 11. Light microscopic evaluation of MRSA after treatment with Gemi-AgNPs and Gemifloxacin.
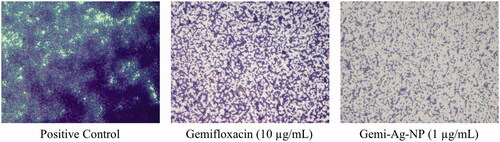
Table 3. Biofilm eradication of gemifloxacin and Gemi-AgNPs.
Figure 12. Cell wall damage of K. pneumoniae. (a) Untreated K. pneumoniae at 500 nm and (b) at 1 µm was used as control, whereas (c) present the bacterial cell wall damage of K. pneumoniae after treatment with Gemi-AgNPs at 200 nm and (d) at 1 µm.
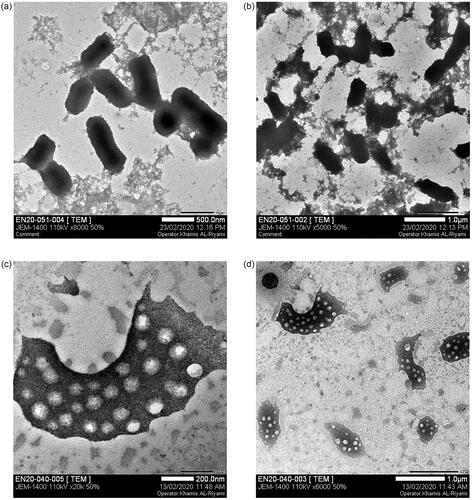
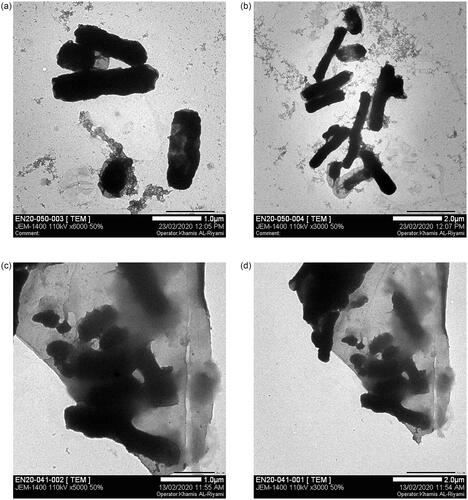
Figure 13. Cell wall damage of E. aerogenes. (a) Untreated E. aerogenes at 1 µm and (b) at 500 nm were used as control, whereas (c) and (d) present the bacterial cell wall damage of E. aerogenes after treatment with Gemi-AgNPs at 500 nm.
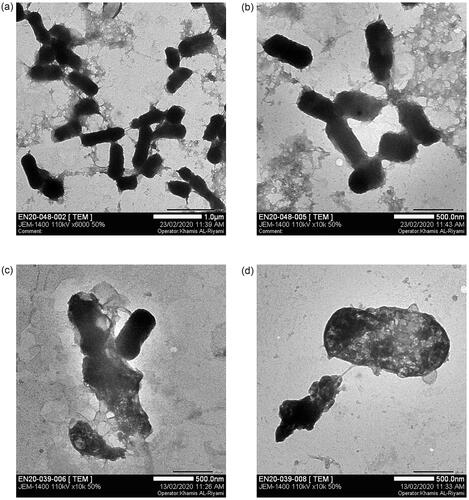
Figure 14. Cell wall damage of E. coli. (a) Untreated E. coli at 1 µm and (b) at 2 µm used as control, whereas (c) present the bacterial cell wall damage of E. coli after treatment with Gemi-AgNPs at 1 µm and (d) at 2 µm.
Data availability statement
All data is included in the submission/manuscript file.