
Figures & data
Figure 1. P3 generation of BMSCs observed by light microscopy at low (A) and high (B) magnification. Cell morphology was consistent with the characteristics of BMSCs.
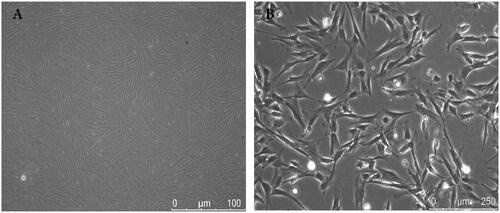
Figure 2. Scanning electron micrographs of non-nanofibrous SF scaffold (A) and nanofibrous SF scaffold (B). FTIR spectrum of SF porous scaffold (C). Crystallinity index of SF scaffold is calculated from the amide III band (D).
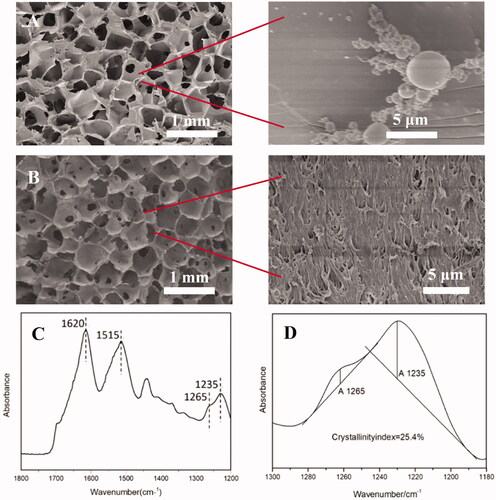
Figure 3. Confocal microscopy (A1, A2, B1, B2) and SEM (A3, B3) images of BMSCs on nanofibrous SF scaffold at day 3 (A1), and day 7 (A2) and (A3); and non-nanofibrous SF scaffold at day 3 (B1), and day 7 (B2) and (B3). TRITC labelled phalloidin (red) stained F-actin, DAPI (blue) stained cell nuclei on the SF scaffolds. Cell Counting Kit-8 (CCK-8) assay demonstrating the difference in the rate of proliferation of BMSCs on different scaffolds (C). BMSCs seeded on nanofibrous SF scaffolds (group B) proliferated more rapidly than on the non-nanofibrous SF scaffold (group A). Difference between Group A and Group B at different culture times were compared. *statistically significant p < .05.
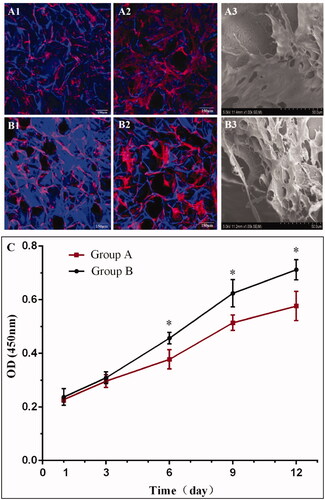
Figure 4. Spinal cord of rats was exposed (A), and a 3-mm SF scaffold seeded with BMSCs implanted into an SCI that was subsequently created (B). BBB scores indicate the significantly increased motor functional recovery of hindlimbs after the implantation of nanofibrous SF scaffold (C). Difference was considered statistically significant when *p < .05 compared with the SCI group, #p < .05 compared with the non-nanofibrous SF scaffold group.
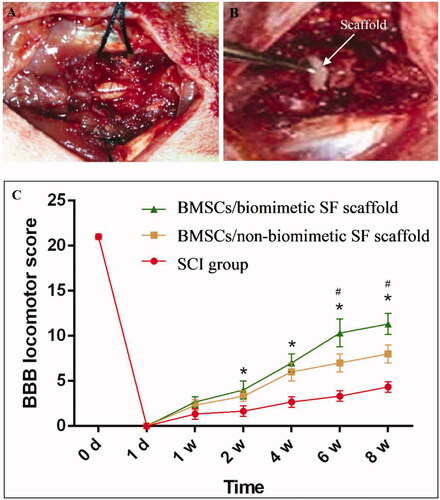
Figure 5. Double immunostaining of the site of injury of spinal cords for astrocytes (GFAP, green) and axons (neurofilament-200, NF-200, red). Compared with BMSCs seeded on the non-nanofibrous SF scaffold (Group A), the BMSC-seeded nanofibrous SF scaffold (Group B) displayed lower positive glial area and higher NF positive axons. Comparison of the fluorescence area of NF-200 positive fibres (C) and GFAP positive area (D) in the rostral (a1, b1), centre (a2, b2), and caudal (c1, c2) of the injury/scaffold site. Difference was considered statistically significant when *p < 0.05.
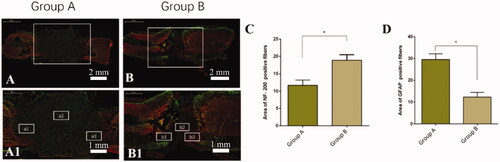
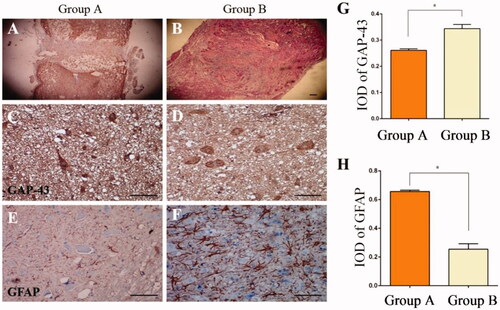
Figure 6. Spinal cord injury with HE staining, indicating that scar tissue in the nanofibrous SF scaffold group (B) was less than in the non-nanofibrous SF scaffold group (A). Transplantation of the nanofibrous SF scaffold group integrated well with the existing spinal cord, with less scar tissue (B). There was partial breakdown of the transplant in Group A, with a cavity observed within the spinal cord. Immunohistochemical staining was conducted to detect the expression of GAP-43 (C, D) and GFAP (E, F) 8 weeks after transplantation. Significant differences were observed in the absorbance value ratios for GAP-43 and GFAP in each group (p < .05), IOD: Integrated Optical Density, Control: Non-nanofibrous SF scaffold, BMSCs/Tussah SF: Nanofibrous SF scaffold, bar = 100 μm.
Data availability statement
The data that support the findings of this study are available from the corresponding author, [TTD], upon reasonable request.