Figures & data
Figure 1. Oxygen delivery to the spinotrapezius muscle. Measurements were collected at 15 min intervals. Baseline (BL) followed stabilization from surgery and was collected during normal breathing. Hypoventilation (60% tidal volume with normal breath rate) was then initiated and maintained for the duration of the experiment. The first gavage occurred following the 60 min measurement and the second after 120 min as demarcated by the dotted lines. Of note, the second Ox66™ gavage had a longer duration of impact on oxygen delivery than the first, but both produced significant PISFO2 responses within 15 min of treatment.
Data are mean ± SEM; N = 26 sites/group.
*Indicates p<.05 compared to BL.
β Indicates p<.05 between groups.
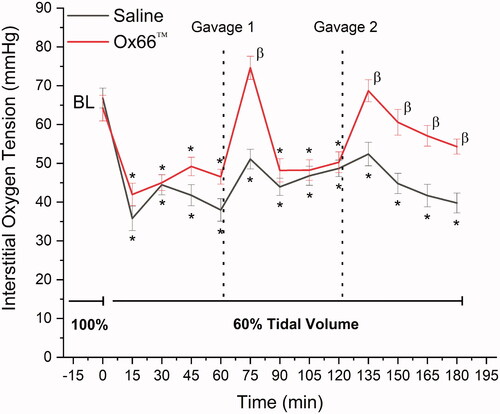
Table 1. Systemic variables.
Table 2. Arterial blood gases and chemistry.
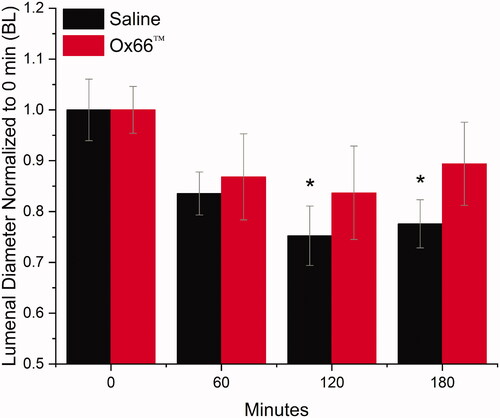
Figure 2. Diameters of resistance arterioles. Arterial diameters, as an indicator of resistance to blood flow, were imaged every hour using intravital microscopy. Reductions in diameter indicate increased peripheral resistance to blood flow. The first measurement (0 min) occurred before the onset of hypoventilation. The 60-min measurement reflects 60 min of hypoventilation without treatment. Gavages were administered following 60- and 120-min. Measurements used a digital ruler calibrated to a standard microscope stage micrometer. Raw measurements were normalized to 0 min (BL) and reported as mean ± SEM. N = 17 and 11 arterioles for Saline and Ox66™ respective.
*Indicates p<.05 compared to BL.
Intergroup comparisons did not reveal significant differences.