Figures & data
Figure 1. Schematic diagram of experimental grouping.
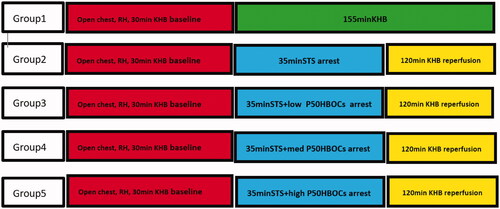
Figure 2. The heart rate(A), LVEDP(B), LVDevP(C), ±dp/dt(D and E) of the heart in each group in the baseline and after 120 min reperfusion. The data of at the 120 min reperfusion period between five groups was compared by ANOVA (n = 3). *p < 0.05 **p < 0.01 vs Control group, &p < 0.05, &&p < 0.01 vs Low P50 HBOCs.
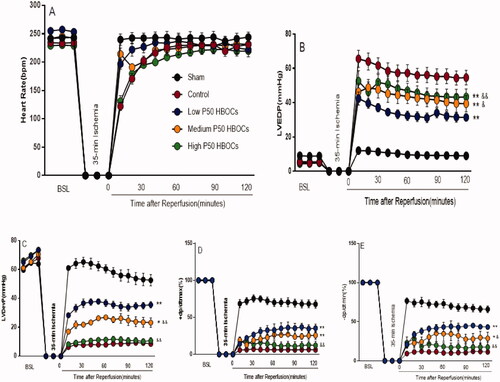
Figure 3. Partial oxygen pressure (PO2) in the perfusion fluid during the baseline, ischemia, and after 120 min reperfusion. Data between five groups was compared by ANOVA (n = 3). At the baseline, ischemic and terminal periods, there was no significant difference in blood gas PO2 among the each groups.
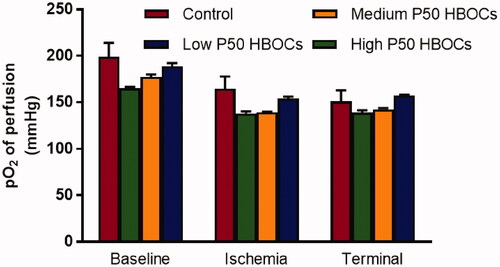
Figure 4. The release amount of CK-MB(A), LDH(B), α-HBDH(C), cTnI(D) in the heart during the baseline, ischemia, and after 120 min reperfusion. Data between five groups was compared by ANOVA (n = 3). *p < 0.05, **p < 0.01 vs Control group, &&p < 0.01 vs Low P50 HBOCs.
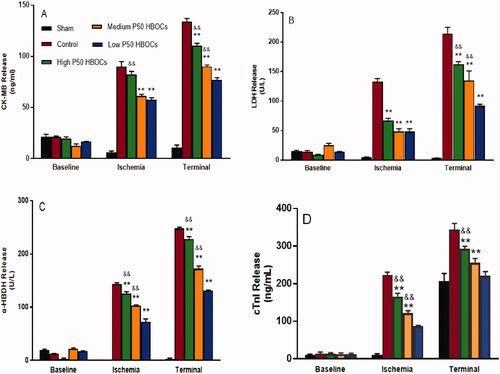
Figure 5. Representative photomicrographs of HE-stained of myocardium in each group. Magnification *400, scale bar: 50 μm. 4 photomicrographs per group. The inflammation of photomicrographs of HE-stained of cardiac tissue in the low P50 HBOCs was significantly lower than the control group and Medium P50 HBOCs. The first group serves as a control group to study the protection of the myocardium in the other three groups.
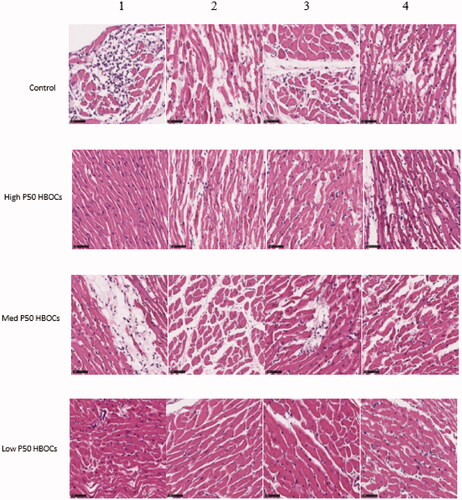
Table 1. Differences in the inflammation score of photomicrographs of HE-stained of cardiac tissue in each group (n = 4) (
±SD).
Figure 6. Activity of Caspase-3 in cardiomyocytes in each groupData between five groups was compared by ANOVA (n = 3). **p < 0.01 vs Control group, &p < 0.05, &&p < 0.01 vs Low P50 HBOCs.
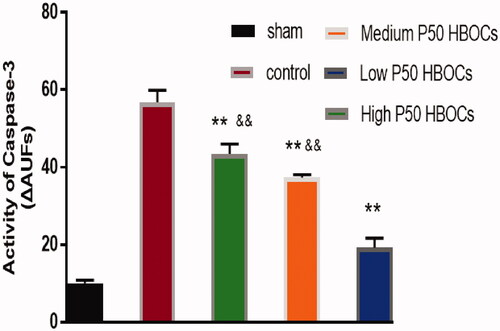
Figure 7. Mitochondrial Cytochrome C (Cyt-C) content in each group. Data between five groups was compared by ANOVA (n = 3). **p < 0.01 vs Control group, &p <0.05, &&p < 0.01 vs Low P50 HBOCs.
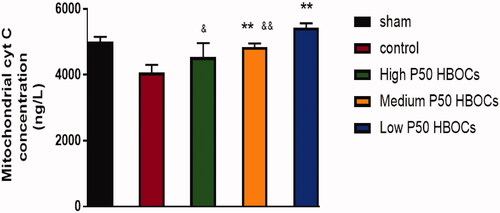
Figure 8. Mitochondria ATP concentration in each group. Data between five groups was compared by ANOVA (n = 3). The mitochondria ATP concentration in sham group was significantly higher than the other experimental groups, and there was no statistically significant difference between the four experimental groups.
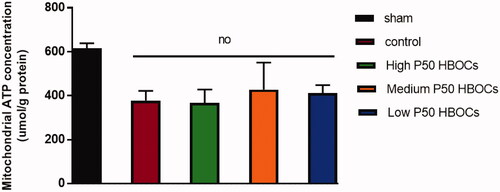
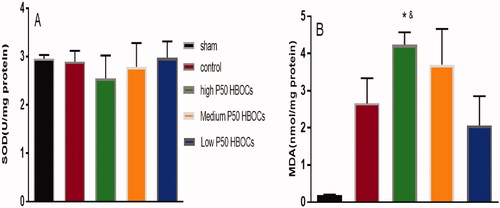
Figure 9. SOD content and MDA content in cardiomyocytes in each group. Data between five groups was compared by ANOVA (n = 3). *p < 0.05 vs Control group, &p < 0.05 vs Low P50 HBOCs.