
Figures & data
Figure 1. Size distribution of SeNP in root and shoot tissues of barley and brown mustard plants. Histograms for the sp-ICP-MS analysis of the first duplicate of (a) mustard root, (c) mustard shoot, (e) barley root and (g) barley shoot and the second duplicate of (b) mustard root, (d) mustard shoot, (f) barley root and (h) barley shoot. The error indicators represent the standard deviation for the three replicates that were measured from every sample. While in some measurements, nano particles with a size of up 400 nm where detected, these histograms are cropped to show the main distribution of SeNP. A full list of the results and histograms showing individual data points for every run can be found in the supplementary information.
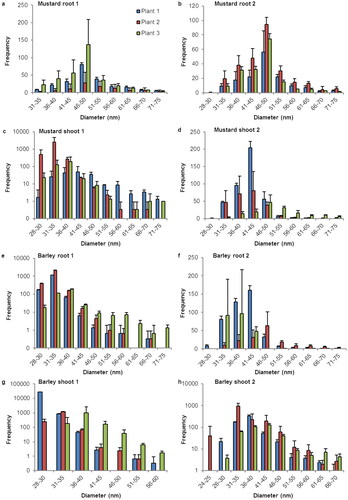
Figure 2. Size distribution of SeNP in root and shoot tissues of linum and lens plants. Histograms for the sp-ICP-MS analysis of the first duplicate of (a) linum root, (c) linum shoot, (e) lens root and (g) lens shoot and the second duplicate of (b) linum root, (d) linum shoot, (f) lens root and (h) lens shoot. The error indicators represent the standard deviation for the three replicates that were measured from every sample. While in some measurements, nano particles with a size of up 400 nm where detected, these histograms are cropped to show the main distribution of SeNP. A full list of the results and histograms showing individual data points for every run can be found in the supplementary information.
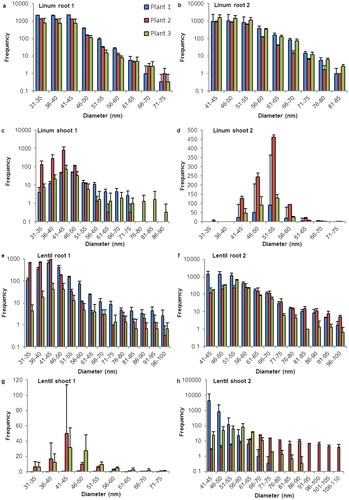
Figure 3. Size distribution of SeNP in root and shoot tissues of capsicum and butter lettuce plants. Histograms for the sp-ICP-MS analysis of the first duplicate of (a) capsicum root, (c) capsicum shoot, (e) butter lettuce root and (g) butter lettuce shoot and the second duplicate of (b) capsicum root, (d) capsicum shoot, (f) butter lettuce root and (h) butter lettuce shoot. The error indicators represent the standard deviation for the three replicates that were measured from every sample. While in some measurements, nano particles with a size of up 400 nm where detected, these histograms are cropped to show the main distribution of SeNP. A full list of the results and histograms showing individual data points for every run can be found in the supplementary information.
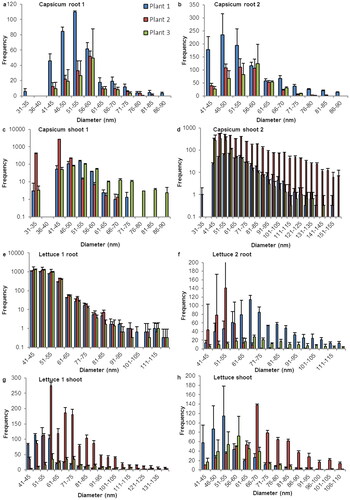
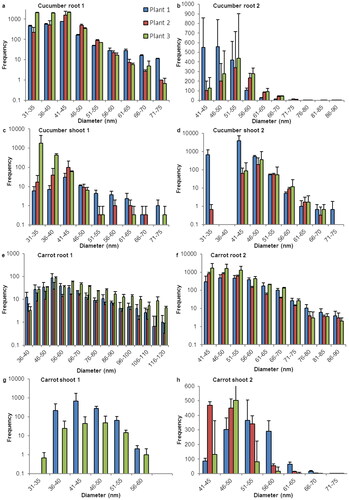
Figure 4. Size distribution of SeNP in root and shoot tissues of cucumber and carrot plants. Histograms for the sp-ICP-MS analysis of the first duplicate of (a) cucumber root, (c) cucumber shoot, (e) carrot root and (g) carrot shoot and the second duplicate of (b) cucumber root, (d) cucumber shoot, (f) carrot root and (h) carrot shoot. The error indicators represent the standard deviation for the three replicates that were measured from every sample. While in some measurements, nano particles with a size of up 400 nm where detected, these histograms are cropped to show the main distribution of SeNP. A full list of the results and histograms showing individual data points for every run can be found in the supplementary information.
Supplemental Material
Download PDF (5.7 MB)Data availability statement
The data for are shown in the supplementary information.