
Figures & data
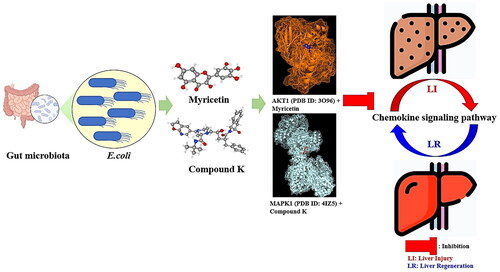
Figure 1. (A) A workflow of this study. (B) The number of 668 overlapping targets between SEA (1256) and STP (947). (C) The number of 61 targets between 668 targets and liver regeneration-related targets (365). (D) The identification of 13 core targets between 61 targets and Gut human targets (223 targets) from gutMGene database. SEA: Similarity Ensemble Approach; STP: SwissTargetPrediction; PPI: protein–protein interaction; GO: gene ontology; MSTM: microbiota-signalling pathways-targets-metabolite.
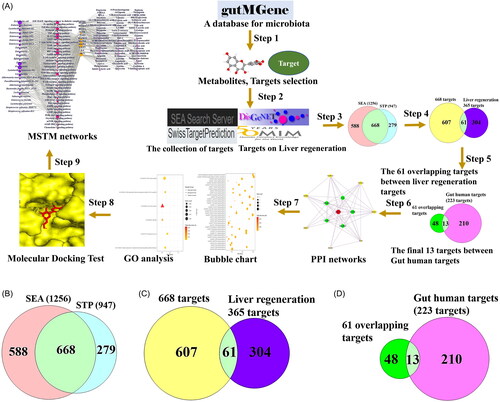
Table 1. The degree value of core targets.
Table 2. The number of 36 signalling pathways and targets related to LR.
Table 3. The evaluation of drug-likeness properties on two key metabolites.
Figure 2. (A) The protein–protein interaction (PPI) networks (13 nodes and 58 edges). (B) Bubble plot of 36 signalling pathways related to liver regeneration (LR). (C) Gene ontology (GO) enrichment analysis.
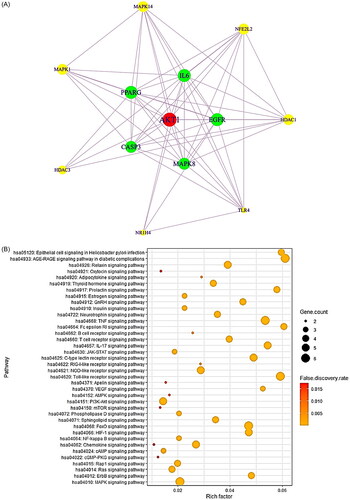
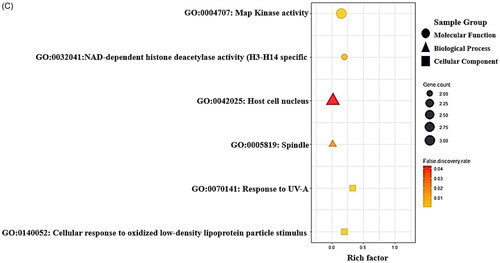
Figure 3. (A) The docking result of myricetin-AKT1. (B) The docking result of Compound K-MAPK1. (C) Microbiota-signalling pathways-targets-metabolite (MSTM) networks (144 nodes, 499 edges).
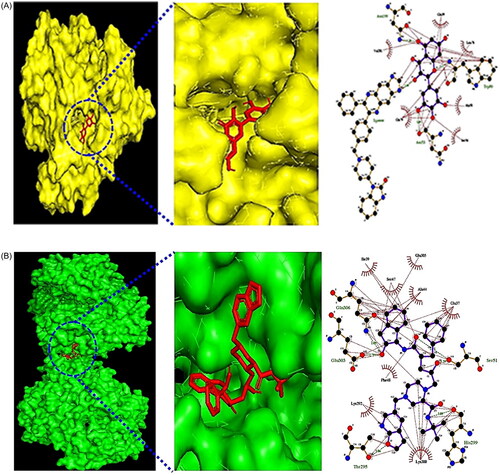
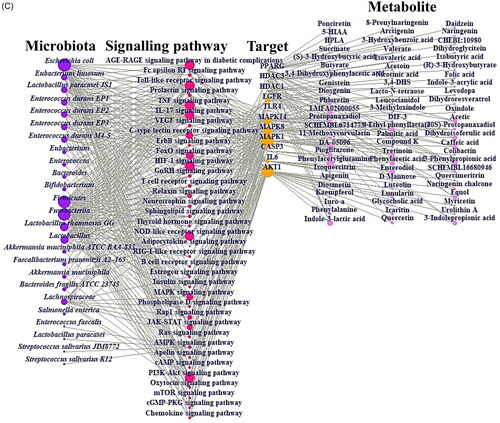
Table 4. The evaluation of toxicity on two key metabolites.
Supplemental Material
Download MS Excel (11.6 KB)Supplemental Material
Download MS Excel (13.1 KB)Supplemental Material
Download MS Excel (42.7 KB)Supplemental Material
Download MS Excel (12.7 KB)Supplemental Material
Download MS Excel (11.7 KB)Data availability statement
All data generated or analysed during this study are included in this published article (and its Supplementary Information files).