
Figures & data
Figure 1. ALA-450 nm inhibited cell viability of End1 and HeLa cells and caused no damage in HaCaT cells. (A) Cells were treated with various concentrations of ALA (0, 0.05, 0.1, and 0.2 mmol/L), (B) and various intensities of irradiation (0, 3, 6, 12, and 24 J/cm2). (C and D) The ALA-PDT (450 nm; 0.1 mmol/L, 6 J/cm2) induced the cell death of End1 and HeLa cells detected by fluorescence microscope (40×). (E) The cell viability of HaCaT, End1 and HeLa cells treated with 5-ALA (0.1 mmol/L) or 450 nm (10 mW/cm2) only. (F) Live and dead cell double staining of HaCaT cells treated with ALA-450 nm (40×). (G) The apoptosis of HaCaT cells measured by flow cytometry followed by ALA-635 nm and ALA-450 nm. Data represent the mean ± SD (N = 4). *p < 0.05; **p < 0.01; ***p < 0.001; ns, not statistically significant.
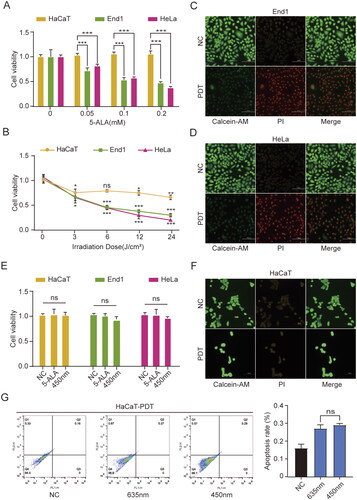
Figure 2. ALA-450 nm had a greater influence than ALA-635 nm on cytotoxicity, cell apoptosis, and ROS generation. (A) End1 cells were respectively treated with ALA-450 nm and ALA-635 nm on different concentrations of ALA (0, 0.05, 0.1, and 0.2 mmol/L). (B) ALA-635 nm and ALA-450 nm caused apoptosis in HeLa cells as determined using flow cytometric analysis with annexin V/PI staining. (C and D) HaCaT and End1 cells were treated with ALA-635 nm and ALA-450 nm respectively under different irradiation intensities (0, 3, 6, 12, and 24 J/cm2). (E) The ROS generation induced by ALA-635 nm and ALA-450 nm in HeLa cells. Data represent the mean ± SD (N = 4). ***p < 0.001, **p < 0.01, *p < 0.05, ns, not statistically significant.
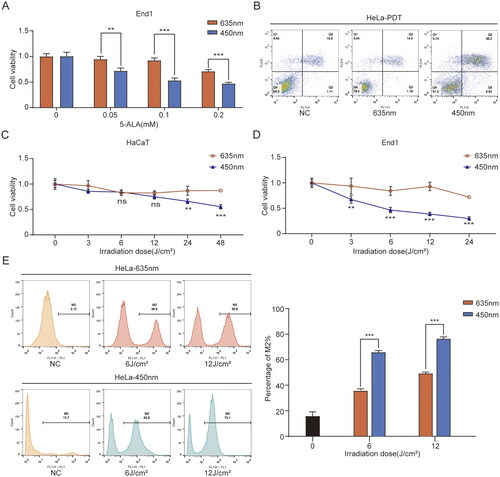
Figure 3. ALA-450 nm activated cell apoptosis in HeLa and End1 cells. (A) Apoptosis induced by ALA-450 nm under different irradiation doses (0, 3, 6, 12 J/cm2) using flow cytometry. (B) The effects of ALA-450 nm on the protein levels of PARP; Cleaved PARP; Caspase-3; Cleaved Caspase-3; Bcl-2 in HaCaT and End1 cells, and the protein level of Caspase-3; Caspase-6; Caspase-9; PARP; Bcl-2 in HaCaT and HeLa cells. (C) The influence of ALA-450 nm on the protein level of Caspase-8, ATG7, LC3 I, LC3 II, p62 in HaCaT and HeLa cells. (D and E) The ROS generation in HeLa and End1 cells activated by diverse light intensity according to ALA-450 nm treatment. (F) Apoptosis induced by ALA-450 nm in End1 cells. Data represent the mean ± SD (N = 3). ***p < 0.001; **p < 0.01.
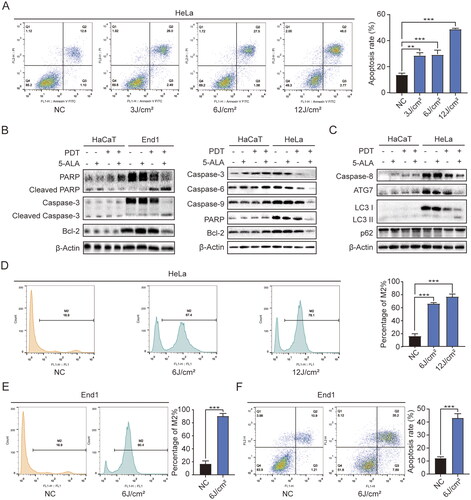
Figure 4. In vivo therapeutic efficacy of ALA-450 nm PDT. (A) Schematic illustration of the schedule for tumour implantation and ALA-450 nm PDT. (B) Images of tumours collected after observation for 14 days. (C) Images of selective sacrificed mice at the end of experiment. (D) The body weight of mice after treatment. (E) Growth curves of tumours in HeLa tumour-bearing mice after different treatments. (F) TUNEL staining (100×) and (G) immunohistochemistry staining (400×) of tumour sections from HeLa tumour-bearing mice 14 days after different treatments. Values are the mean ± SD (N = 5), ***p < 0.001 compared to controls.
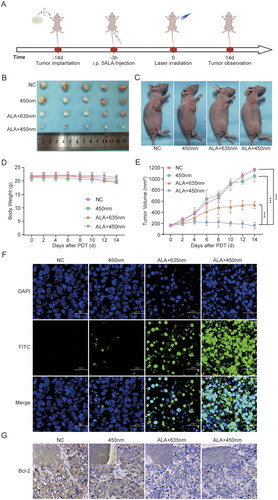
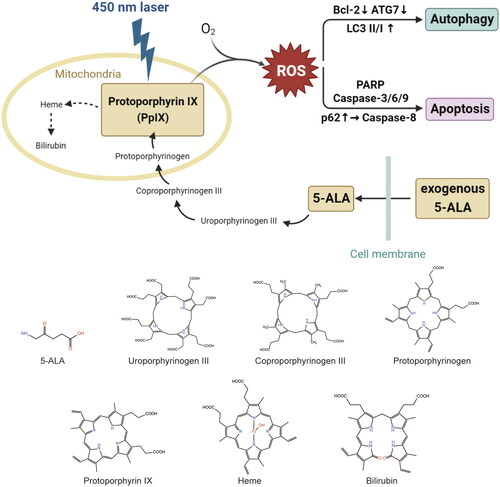
Figure 5. Diagram of ALA-450 nm PDT induced cell death. After the PpIX accumulated in the HPV-infected cervical cells, with the exposure of blue laser and oxygen, the cellular ROS production leads to changes of diversified proteins. The latter further causes cell apoptosis through caspase dependent pathway. Meanwhile, it is verified that multiple autophagy related proteins, such as Bcl-2, ATG7, LC3, are involved in the cell autophagy regulation.
Supplemental Material
Download TIFF Image (1.9 MB)Data availability statement
The data that support the findings of this study are openly available in “figshare” at https://doi.org/10.6084/m9.figshare.21067765.v1.