
Figures & data
Figure 1. The Oxygen-releasing Capacity. (A) Oxygen equilibriumcurves (OEC) of bHb and PCBH. Data are expressed as mean ± SD (n = 3). (B) The P50 values of bHb and PCBH. Data are expressed as mean ± SD (n = 3). (C) The trend of oxyHb% of bHb and PCBH in hypoxic atmosphere (1% O2) for two hours. Data are expressed as mean ± SD (n = 3). (D) The trend of oxyHb% of bHb and PCBH in cyclically reduced atmospheric oxygen levels for 5h. Data are expressed as mean ± SD (n = 3). ** represented p < 0.01.
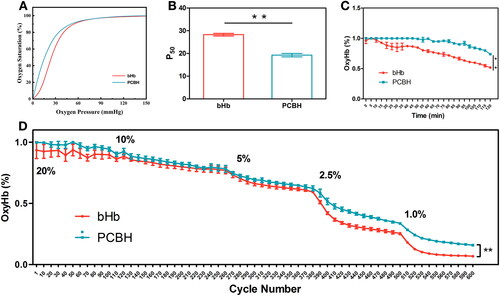
Figure 2. Cell survivals of 4T1 or MCF-7ADR after chemotherapy. Viability of MCF-7ADR cells after treatment with free DOX, bHb-DOX, or PCBH-DOX at different concentrations (1 μg/mL, 2 μg/mL, 4 μg/mL, 8 μg/mL) for 6h (A), (B) and 12h (C), (D) in hypoxia or normoxia. Data are expressed as mean ± SD (n = 3). Viability of 4T1 cells after treatment with free DOX, bHb-DOX, or PCBH-DOX at different concentrations (1 μg/mL, 2 μg/mL, 4 μg/mL, 8 μg/mL) for 6h (E), (F) and 12h (G), (H) in hypoxia or normoxia. Data are expressed as mean ± SD (n = 3). (I) Fluorescence images of γ-H2AX generation in 4T1 cells after treatment with different combination, scale bar = 50 μm. (J) The quantitative analysis of average fluorescent intensity of γ-H2AX in 4T1 cells. Data are expressed as mean ± SD (n = 3). * represented p < 0.05; ** represented p < 0.01.
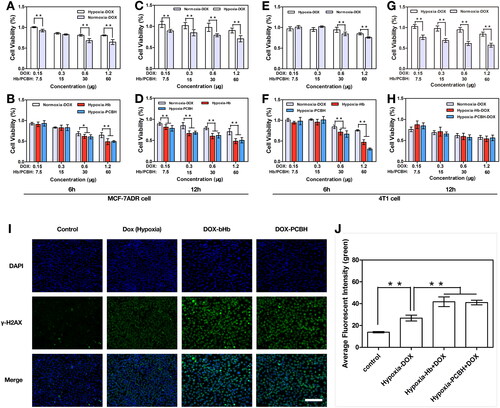
Figure 3. In vivo antitumor efficiency. (A) The picture of tumors excised frommice after 14 days of treatment in different groups. (B) Tumor growth curves measured for 14 days and (C) tumor weight after different treatments. Data are expressed as mean ± SD (n = 7) (D) Hematoxylin and eosin (H&E)-stained tumor slices after treatment in each group at day 14 and (E) necrosis rate of tumors in each group were obtained and analysed by two blinded pathologists under microscope. Data are expressed as mean ± SD (n = 7) (F) Ki-67 immunohistochemical staining images on day 14, scale bar = 50 μm. (G) Quantitative analysis of the relative density of Ki-67 in tumors after treatments. Data are expressed as mean ± SD (n = 7). * represented p < 0.05; ** represented p < 0.01.
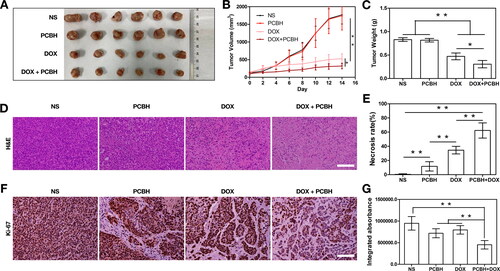
Figure 4. The alleviation of tumor hypoxia. (A) Oxygen content changes of the tumors with different treatments from 0 h to 8 h. (B) Oxygenation values of tumors from 0 h to 8 h. Error bars represent mean ± SD (n=4). (C) HIF-1α and (F) P-gp immuno histochemical staining images on day 14, scale bar = 50 μm. Quantitative analysis of the relative density of (D) HIF-1α and (G) P-gp from immuno histochemically stained tumor section after treatments, and qRT-PCR validation results of (E) HIF-1α and (H) Pgp after treatments. Data are expressed as mean ± SD (n = 7). * represented p < 0.05; ** represented p < 0.01.
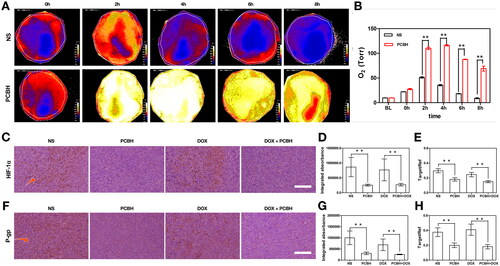
Figure 5. The angiogenesis of tumors with different treatments. (A) VEGF, CD31 and CD34 immunohistochemical staining image s on day 14, scale bar = 50 μm. Quantitative analysis of the relative density of (B) VEGF, (C) CD31 and (D) CD34 from immuno histochemically stained tumor section after treatments. Data are expressed as mean ± SD (n = 7), ** represented p < 0.01.
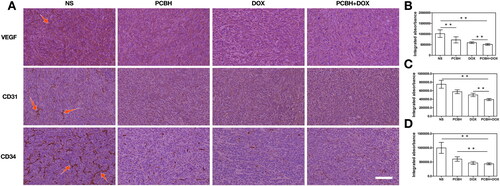
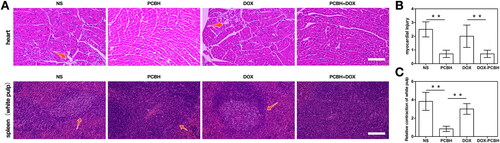
Figure 6. The ability to alleviate DOX-induced splenocardiac toxicity. (A) H&E staining image of hearts and spleens (white pulp) dissected fromtumor-bearing mice after 14 days treatments, scale bar = 50 μm. The statistical analysis of myocardial injury (B) and relative atrophy of white pulp (C) obtained by two blinded pathologists under microscope. The necrotic myocardial cells and white pulp were pointed by arrows. Data are expressed as mean ± SD (n = 7), ** represented p < 0.01.
Data availability statement
The data that support the findings of this study are available from the corresponding author QW upon reasonable request.