
Figures & data

Figure 1. (A, B) Low-resolution TEM images of CQDs showing spherical morphology and dispersed nature; (C) high resolution TEM image of CQDs, showing spherical morphology, lattice fringes and graphitic nature; and (D) Zoom HRTEM image of CQDs showing clear lattice fringes.
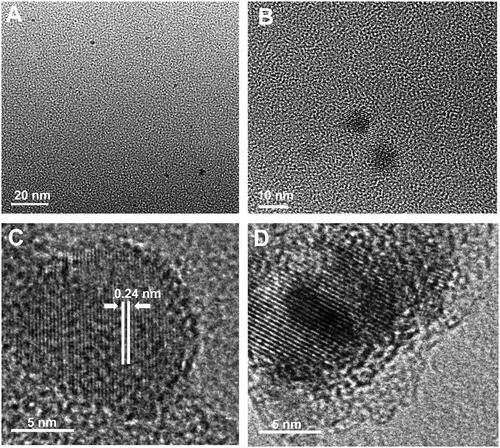
Figure 2. (A) FTIR spectrum of blank and CQDs (B) a Full XPS spectrum. The high-resolution deconvoluted XPS peaks of CQDs for (Ba) C1s, (Bb) O1s, and (Bc) N1s.
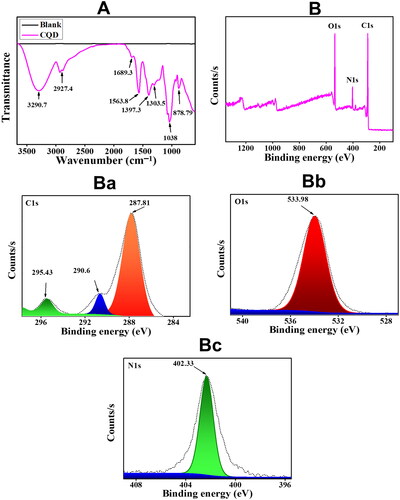
Figure 3. (A) UV-vis spectrum of CQDs (B) Fluorescent emission spectra of CQDs excited at different wavelengths from 300 nm to 490 nm with an increment of 10 nm.
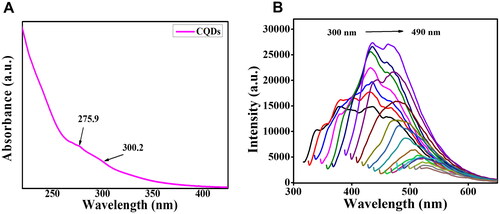
Figure 4. (A) Cell viability assay of human microglial cells (HMC)3 in the presence of CQDs. (B) Effect of CQDs on LPS-induced HMC3 cells. Radical scavenging activity of (C) DPPH and (D) ABTS radials. LPS, lipopolysaccharide; CQDs, carbon quantum dots; DPPH, 2,2-diphenyl-1-picrylhydrazyl; ABTS, 2,2'-azino-bis (3-ethylbenzothiazoline-6-sulfonic acid).
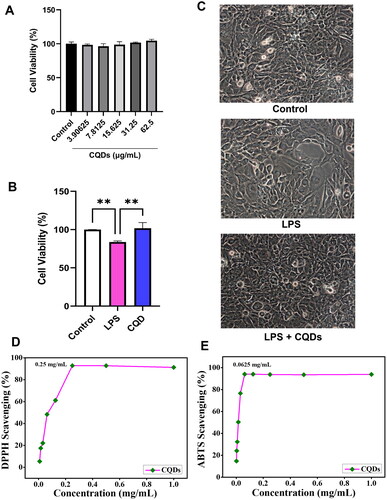
Figure 5. Evaluation of intracellular ROS by DCFDA assay. (A) Effects of CQDs on LPS-activated HMC3 cells. (B) The fluorescent microscopic images of control, LPS-activated and LPS + CQDs co-treated cells. The data are mean ± SD values of triplicates from a representative of three experiments. **** signifies p value < 0.0001. ROS: reactive oxygen species; LPS, lipopolysaccharide; CQDs, carbon quantum dots; DCFDA: 2',7'-dichlorodihydrofluorescein diacetate.
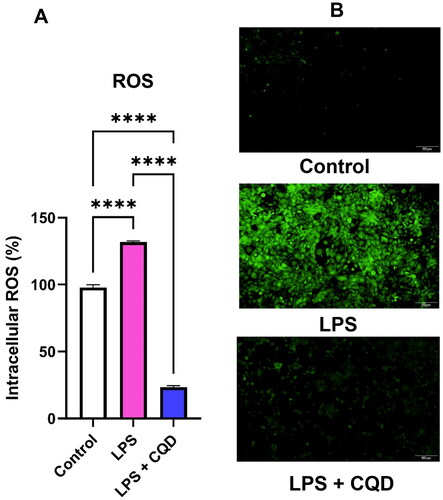
Figure 6. Effects of CQDs on intracellular antioxidant defense system in LPS-stimulated HMC3 cells. Control is representing HMC3 cells without any treatment. The relative mRNA expressions levels of (A) nuclear factor erythroid 2–related factor 2 (nrf2), (B) haem oxygenase (HO)-1, (C) HO-2, (D) superoxide dismutase (SOD), (E) catalase (CAT), (F) glutathione peroxidase (GPx). The symbols **, ***, ****signify p value < 0.01 < 0.001, < 0.0001, respectively. The expressions were normalized to β actin.
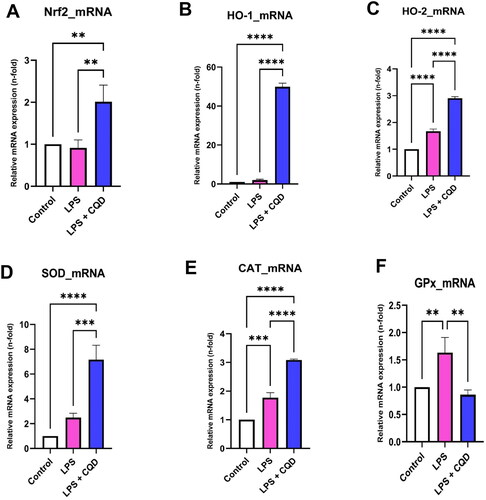
Figure 7. Effects of CQDs on protein expression profiles of antioxidant defense system in LPS-stimulated HMC3 cells using flow cytometry. Control is representing HMC3 cells without any treatment. The relative protein expressions levels of (A) nuclear factor erythroid 2–related factor 2 (nrf2), (B) haem oxygenase (HO)-1, (C) HO-2, (D) superoxide dismutase (SOD), (E) catalase (CAT), (F) glutathione peroxidase (GPx). The symbols *, **, ***, ****signify p value <0.05, < 0.01 < 0.001, < 0.0001, respectively.
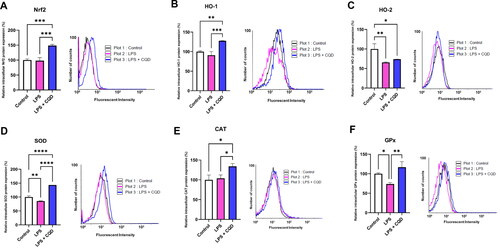
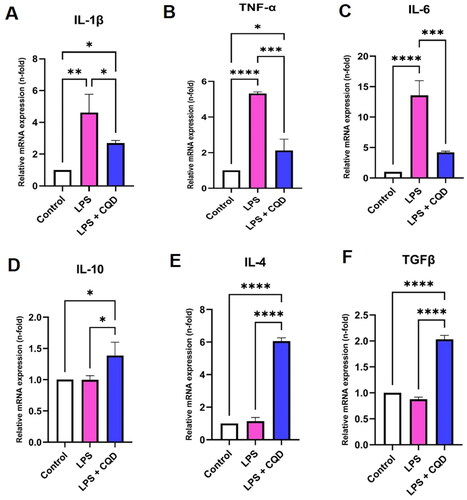
Figure 8. Effects of CQDs on mRNA expression levels of inflammation-related genes. (A-C) The mRNA expression levels of pro-inflammatory genes (A) interleukin (IL)-1β, (B) tumour necrosis factor-alpha (TNF-α), (C) IL-6. The mRNA expression levels of genes related to anti-inflammation, including (D) IL-10, (E) IL-4, and (F)transforming growth factor beta (TGFβ). Control is representing HMC3 cells without any treatment. The symbols *, **, ***, ****signify p value <0.05, < 0.01 < 0.001, < 0.0001, respectively. The expressions were normalized to β actin.
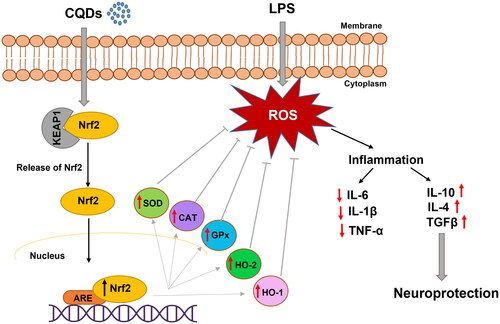
Scheme 1. A schematic representation of antioxidant effects of CQDs on LPS-induced HMC3 cells.
Supplemental Material
Download MS Word (28.3 KB)Data availability statement
The data that support the findings of this study are available from the corresponding author, H-J. L., upon reasonable request.