
Figures & data
Table 1. Amount of Ag-Au and ICG in two different solvents (deionised water and 1% Intralipid) under different reaction times.
Figure 1. Representative normalised absorbance of free Ag-Au and normalised fluorescence of free ICG in deionised water.
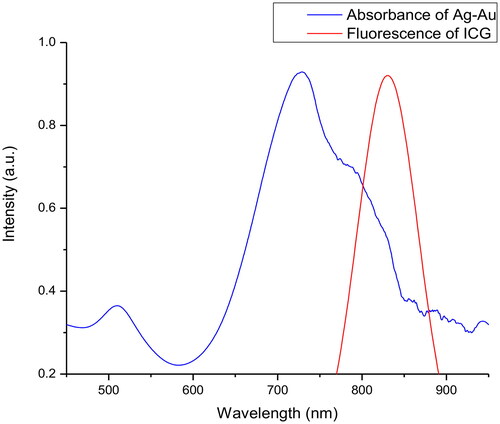
Figure 2. Fluorescence emission profiles of (a) free ICG and (b) Ag-Au-ICG in deionised water at the different molar ratio of Ag-Au:ICG (1).
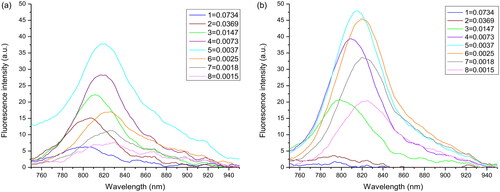
Figure 3. Fluorescence emission profiles of (a) free ICG and (b) Ag-Au-ICG in 1% Intralipid under different molar ratio of Ag-Au:ICG (1).
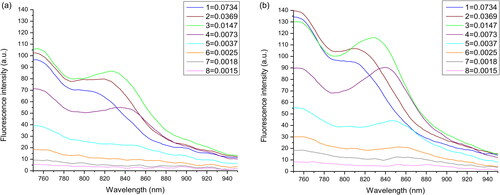
Figure 4. Peak fluorescence intensity of (a) free ICG and (b) Ag-Au-ICG in deionised water under different molar ratio of Ag-Au:ICG(1) for a reaction time period of 0–48 h.
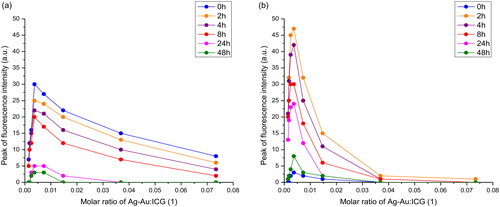
Figure 5. Peak fluorescence intensity of (a) free ICG and (b) Ag-Au-ICG in 1% Intralipid under different molar ratio of Ag-Au:ICG(1) for a reaction time period of 0–48 h.
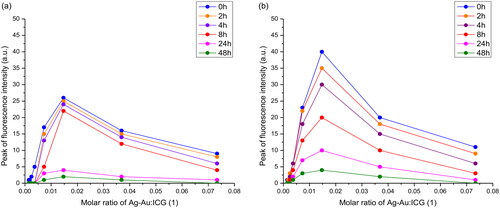
Figure 6. Bright field image of HepG-2 treated with (a) free ICG and (b) Ag-Au-ICG in 1% Intralipid for 1 h.
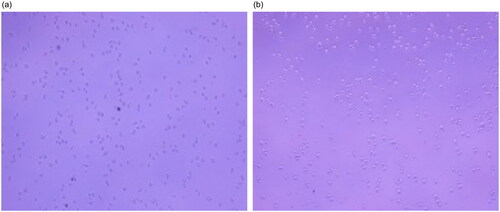
Figure 7. Bright field image of HepG-2 treated with (a) free ICG and (b) Ag-Au-ICG in 1% Intralipid for 2 h.
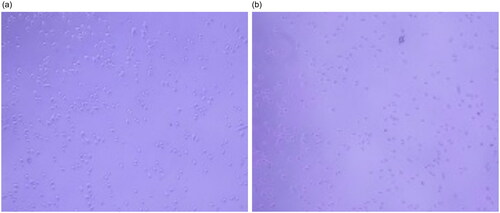
Figure 8. Fluorescence image of HepG-2 treated with (a) free ICG and (b) Ag-Au-ICG in 1% Intralipid for 1 h. Scale bar, 50 µm.
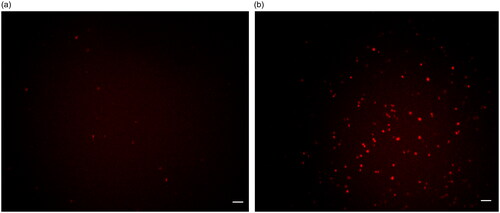
Figure 9. Fluorescence image of HepG-2 treated with (a) free ICG and (b) Ag-Au-ICG in 1% Intralipid for 2 h. Scale bar, 50 µm.
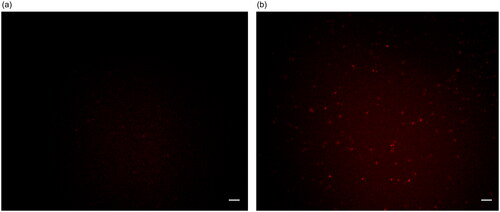
Table 2. Optical properties of Ag-Au-ICG and free ICG in deionised water at 0 h. Fluorescence quantum yield of standard ICG in water was 0.042 [Citation33].
Table 3. Optical properties of Ag-Au-ICG and free ICG in 1% Intralipid at 0 h. Fluorescence quantum yield of standard ICG in emulsion was 0.086 [Citation21,Citation22].
Table 4. Comparative cell apoptosis induced by ICG and Ag-Au-ICG in a human cancer cell line (HepG-2) and a human normal cell line (HaCat). MFI: Mean fluorescence intensity (a.u.).
Data availability statement
The authors confirm that the data supporting the findings of this study are available within the article.