
Figures & data
Figure 1. Proposed Novel Computational Model for Extracellular Signal Regulated Kinase protein.
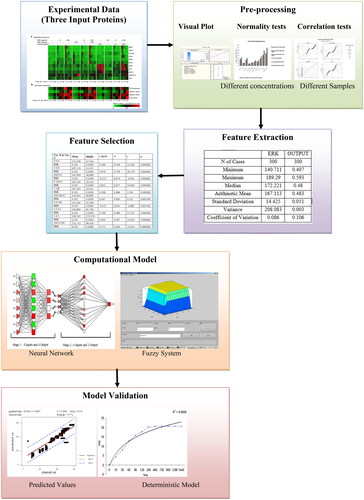
Figure 2. Statistical summary of Extracellular Signal Regulated Kinase protein (a) Kolmogorov-Smirnov plot (b) P-P plot, (c) various statistics values and (d) box plot.
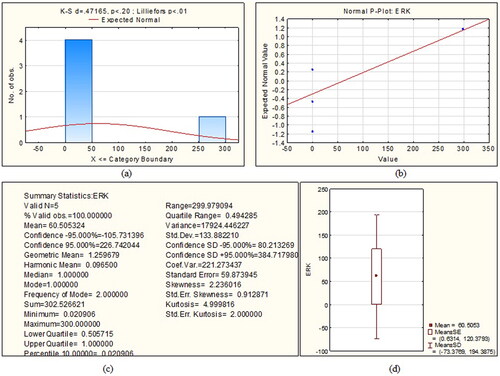
Figure 3. The normal, Kaplan Meier (KM) and Herd Johnson (HJ) method values for the Least Square (LS), and Maximum Likelihood (ML) technique.
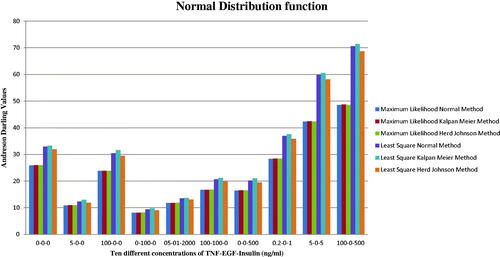
Figure 4. Plots for the Maximum Likelihood technique using normal distribution function.
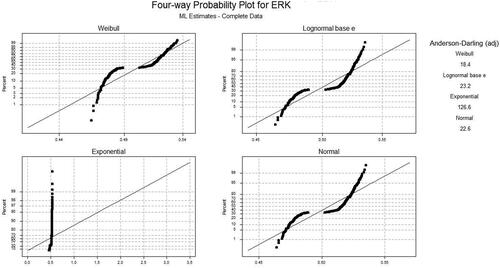
Figure 5. Different plots for the Least Square technique using normal distribution function.
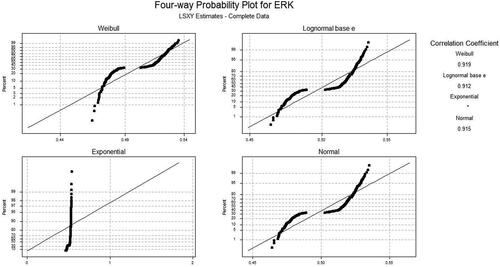
Figure 6. Computational Fuzzy model for predicting cell death /survival.
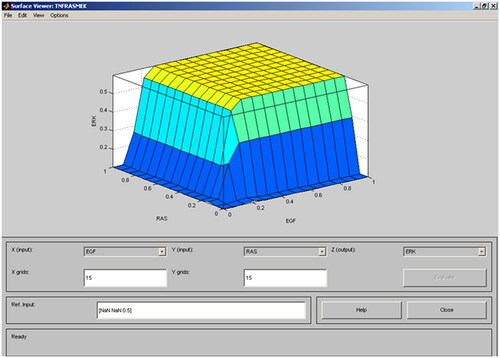
Figure 7. Computational model using Neural Network.
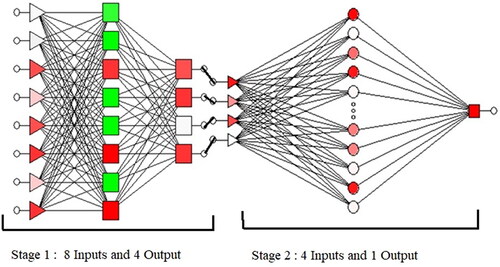
Figure 8. Graph of observed and predicted value.
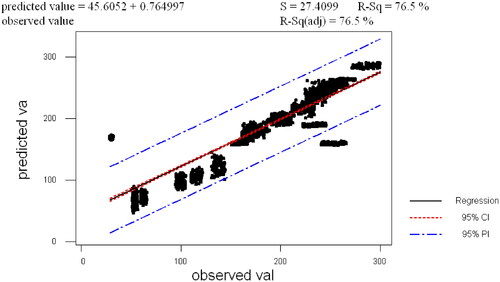
Figure 9. Results of deterministic model using difference equations.
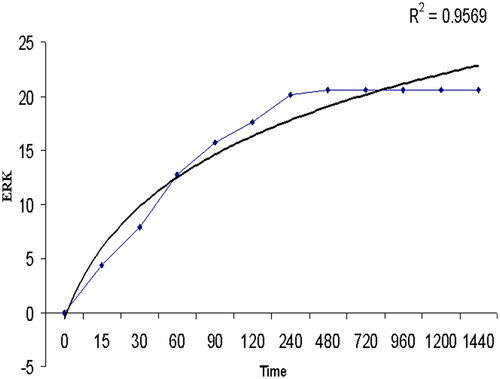
Table 1. Different concentrations of tumour necrosis factor (TNF)-epidermal growth factor (EGF)-insulin.
Table 2. Algorithm for the detection of cell survival/ death.
Table 3. Pearson correlation coefficient (PCC) for least square method.
Table 4. Correlation values for extracellular signal regulated kinase protein.
Table 5. Kaplan Meier, Normal, and Herd Johnson values using maximum likelihood of the different distribution functions for Extracellular Signal Regulated kinase protein.
Table 6. Anderson Darling values for different distribution functions based on different samples.
Table 7. Comparison of Anderson Darling values for the two different computational models.
Table 8. Different features of Extracellular Signal Regulated Kinase (ERK).
Data availability statement
The data analysed during the current study are not publicly available but is available from the corresponding author on reasonable request.